Time Travel
Time Travel lets you view the dashboard as it existed at any point in the past — where workers were, where equipment was, which jobs were active, and what events occurred.
Selecting a time range
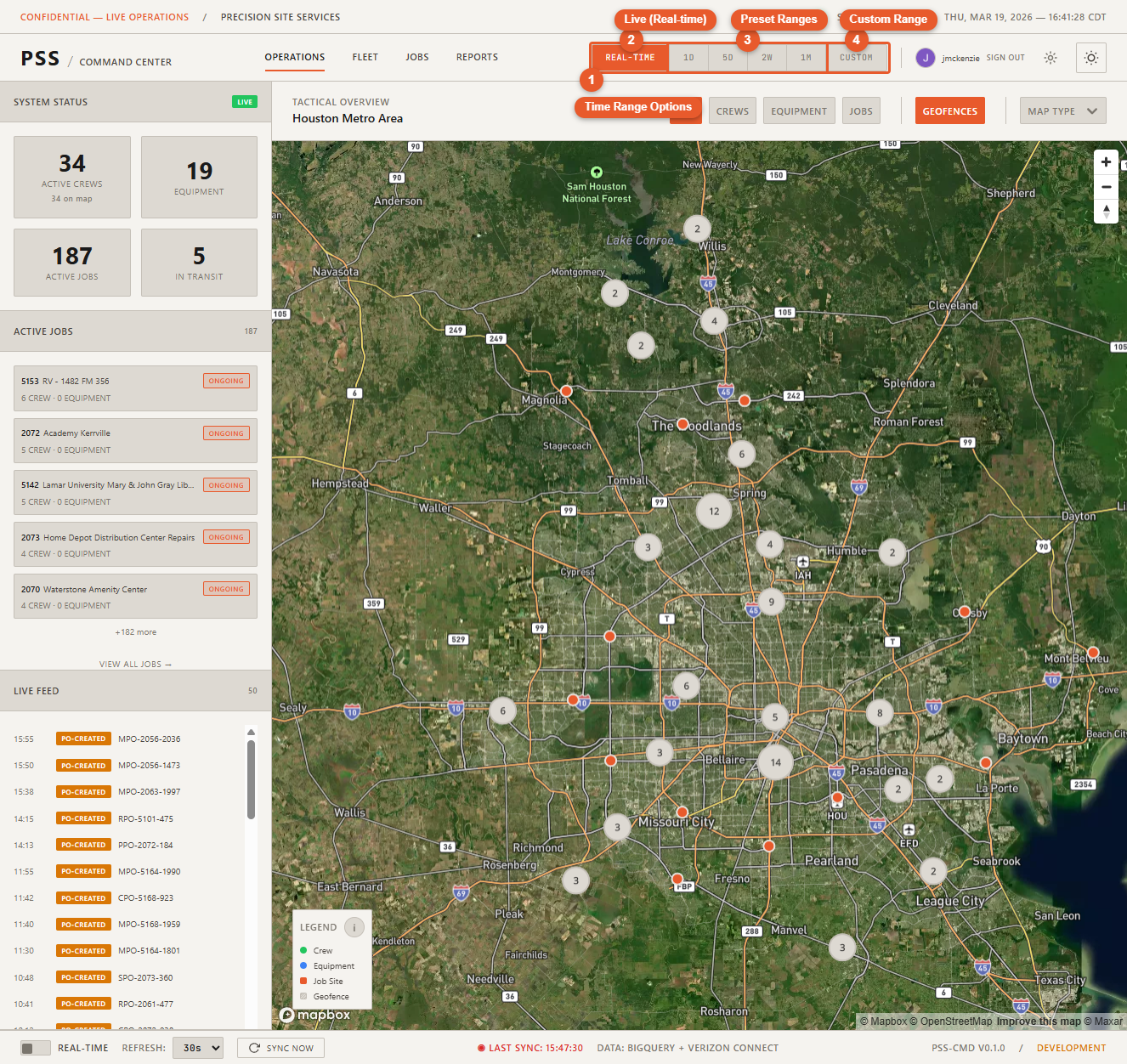
The time selector is available in the Operations map header. Choose from preset ranges or set a custom period:
| Option | What you see |
|---|---|
| Real-time | Current live data (default) |
| 1D | Yesterday's data |
| 5D | Past 5 days |
| 2W | Past 2 weeks |
| 1M | Past month |
| Custom | Pick any start and end date |
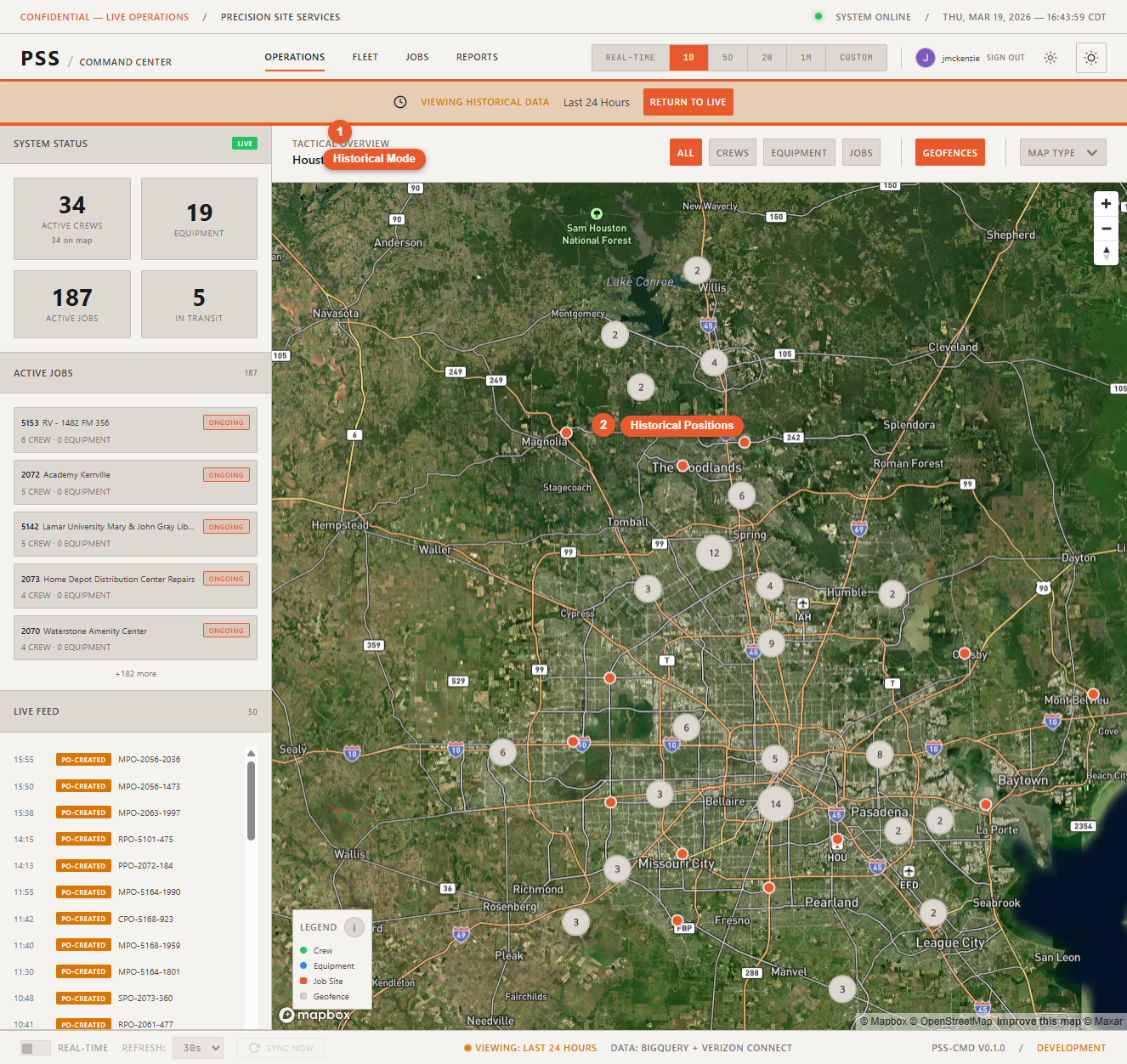
Historical mode indicator
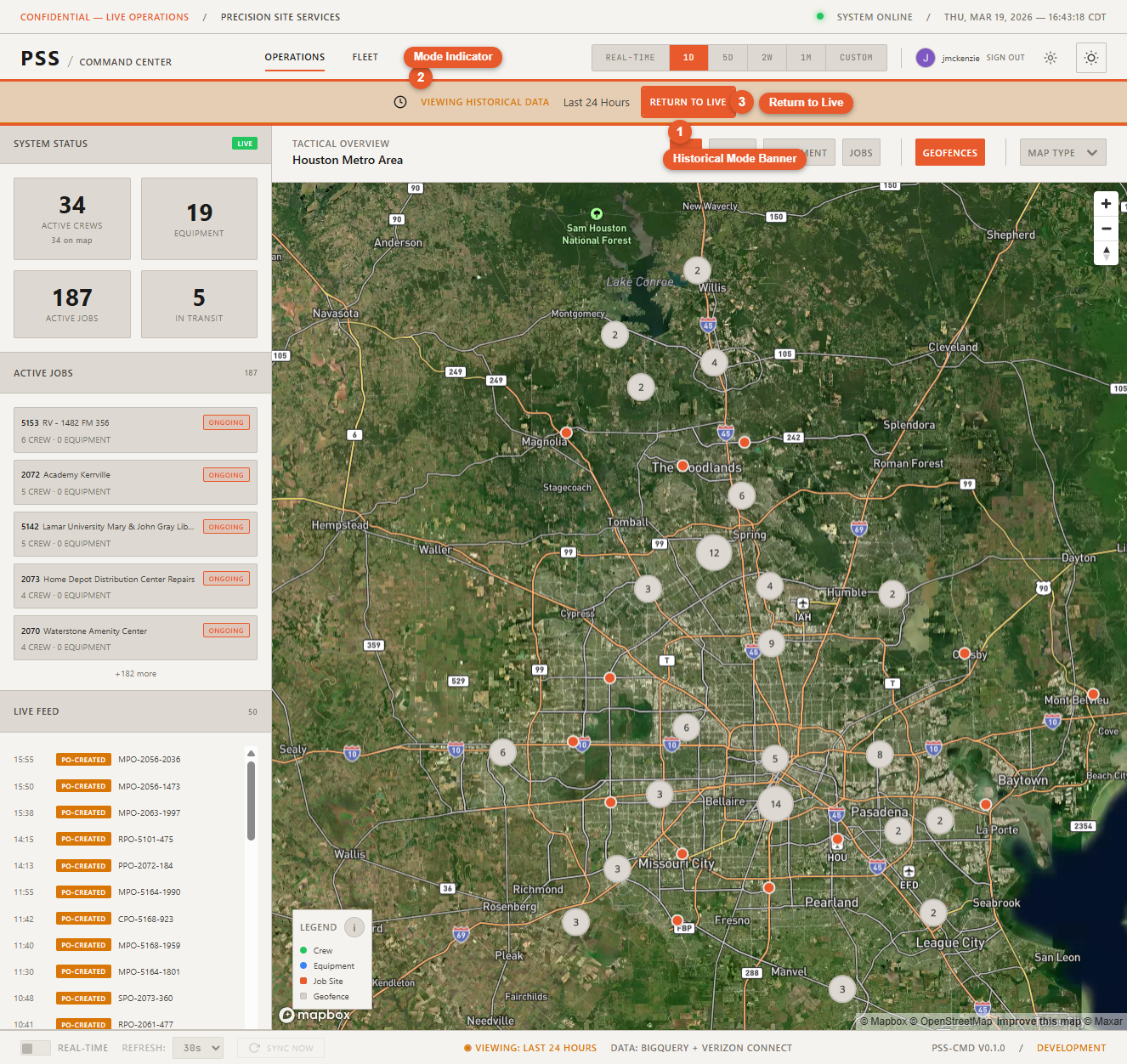
When you are viewing historical data (any mode other than Real-time), a banner appears in the header indicating that you are in historical mode and showing the time range you are viewing. All map markers, detail panels, and the live feed reflect the selected historical period.
How it works
Historical data comes from two sources:
- Worker movement — Stored in Firestore, populated nightly from BigQuery
- Equipment movement — Stored in Firestore, populated nightly from Verizon Reveal
- PO history — Queried directly from BigQuery on demand
Data is available for any period that has been captured by the nightly ETL process.
Returning to real-time
Select Real-time in the time selector to exit historical mode and return to live data. The historical mode banner disappears and the dashboard resumes live polling.