The Interface
A tour of the dashboard's chrome — the parts of the screen that stay put while pages change. After reading this you should be able to find any major feature without hunting.
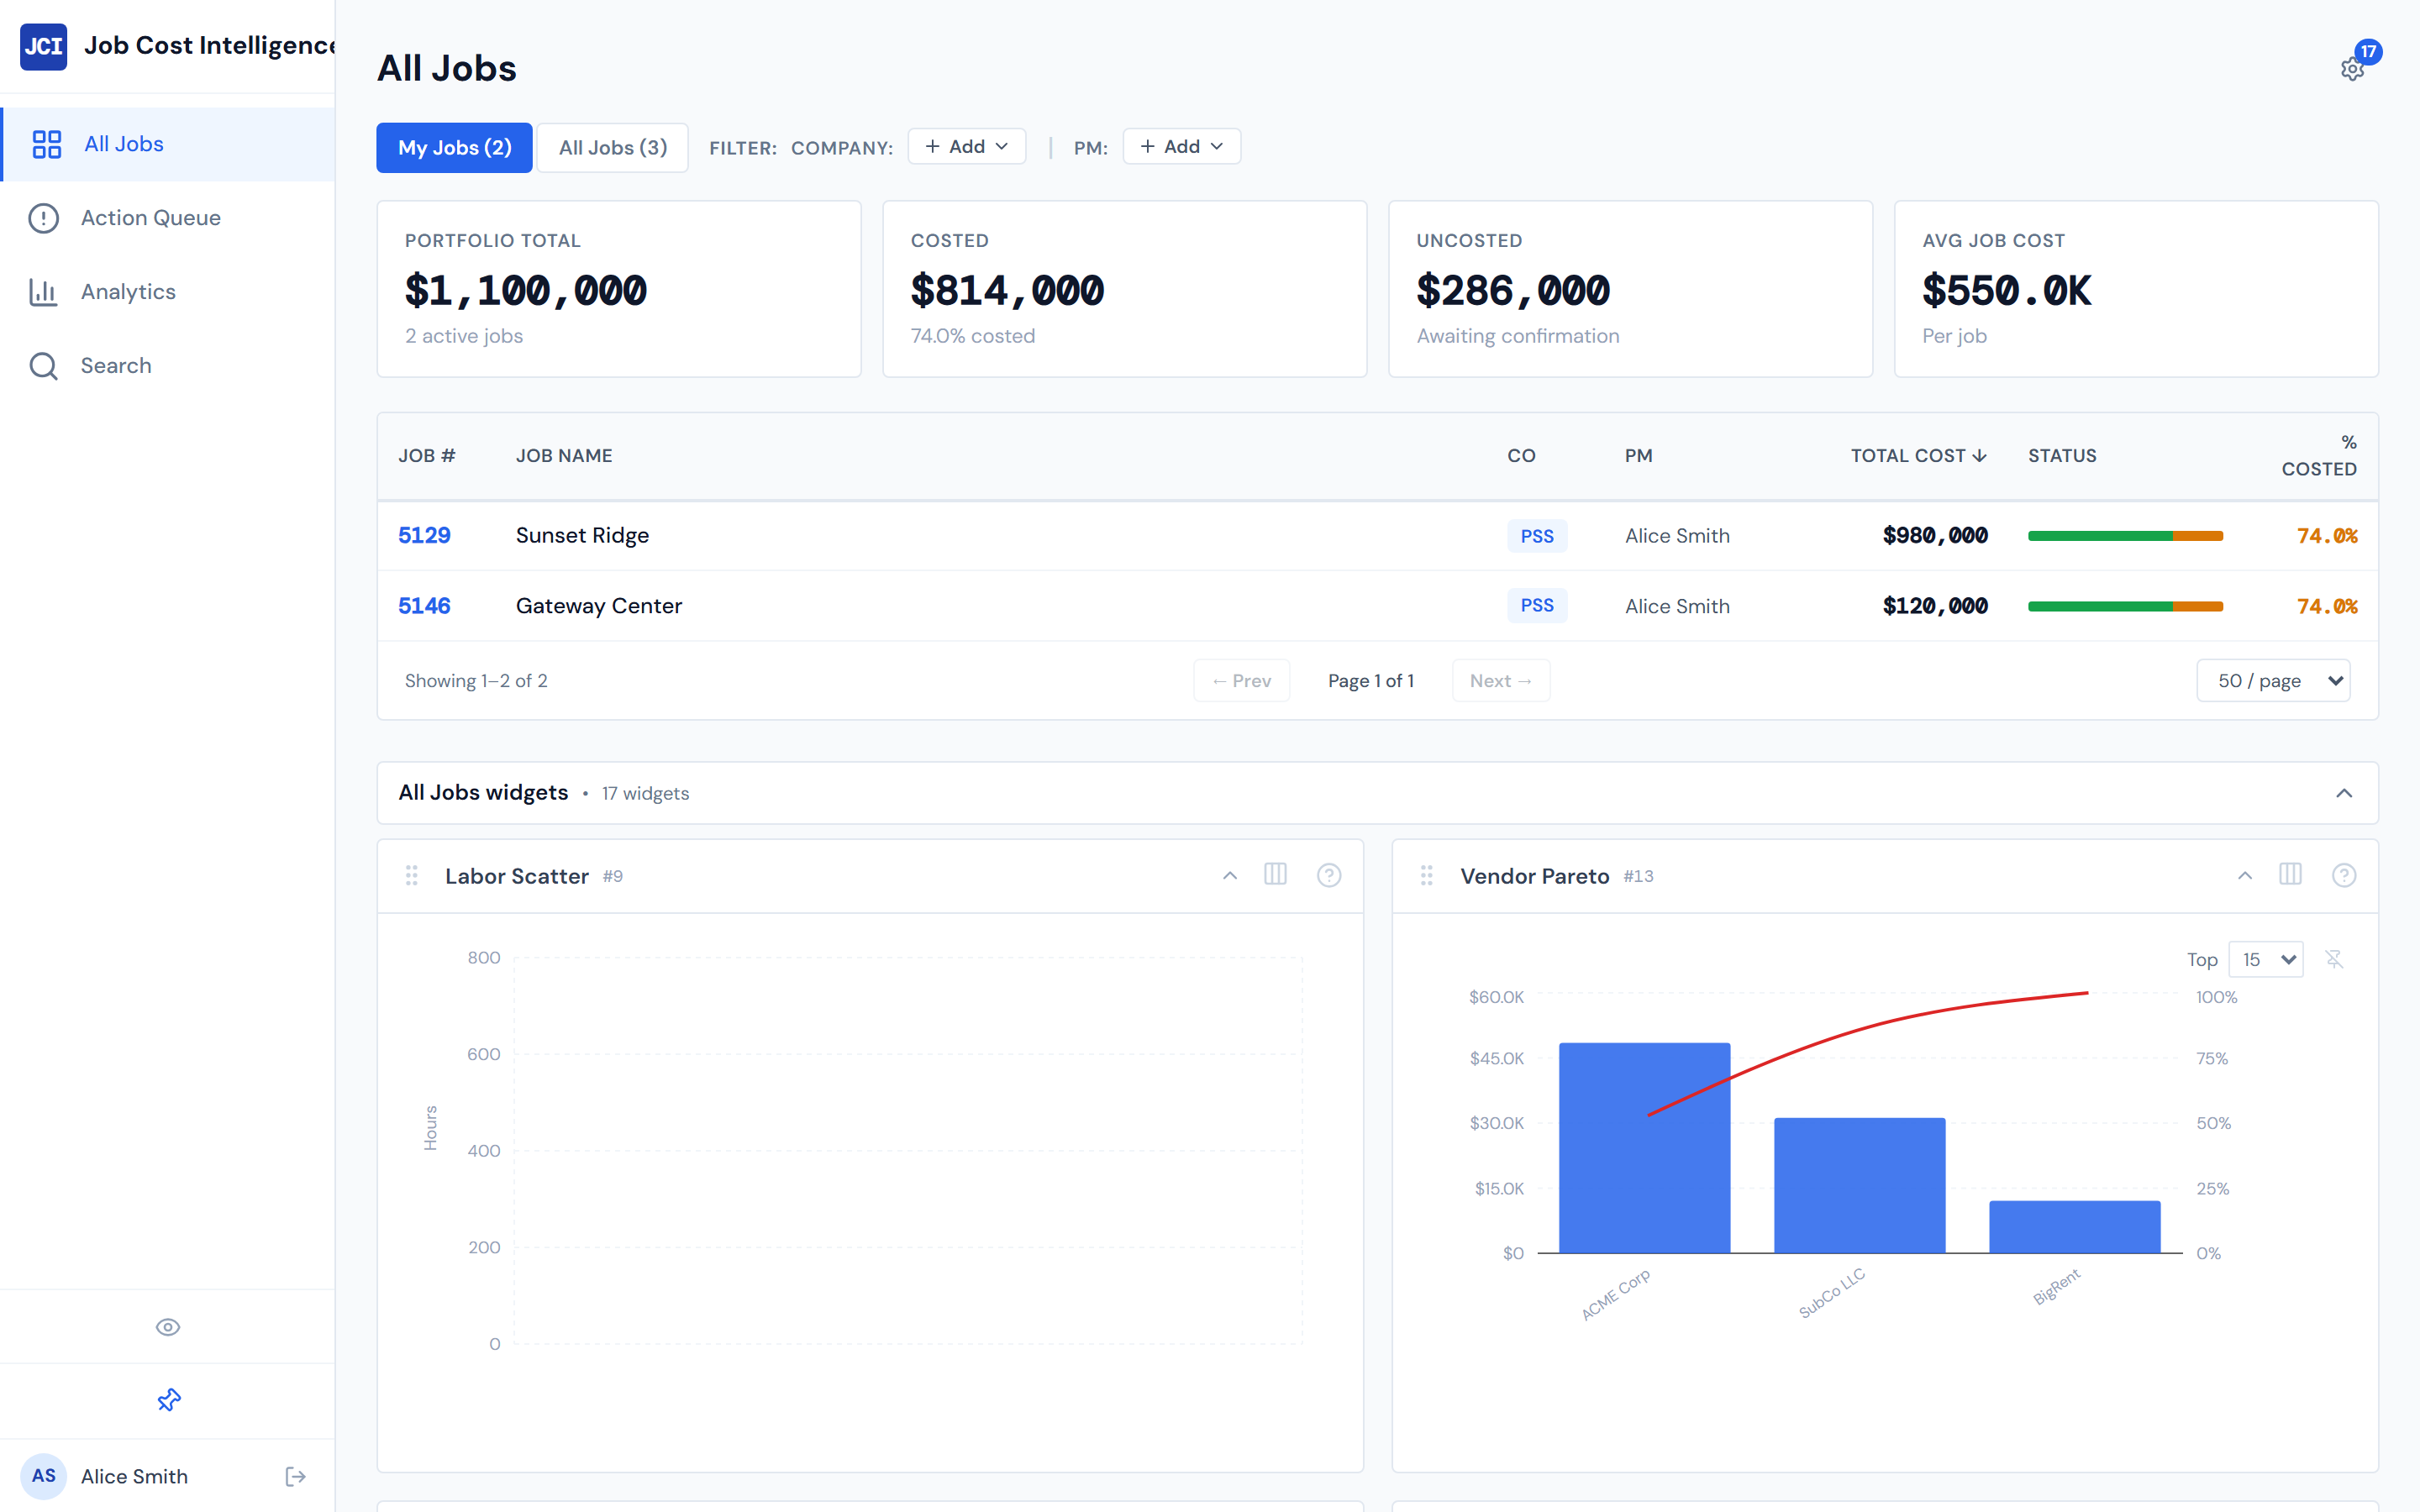
The overall layout
Every page on JCI shares the same frame:
- A sidebar on the left with navigation, search, and your account
- A top filter bar above the page content with the My Jobs toggle and any page-specific controls
- A main content area in the middle and right, where the actual page renders
- A status bar at the top of the content showing how fresh the data is
Pages change. The frame doesn't.
The sidebar, top to bottom
The sidebar is the spine of the dashboard. Read it top-to-bottom and you'll see every region.
Pin / collapse
At the very top is a pin button. Click it to keep the sidebar fully expanded with labels visible, or unpin it to let it collapse to icons only when your cursor is elsewhere. Pinning is useful when you're doing focused work; unpinning gives you more horizontal space for wide tables.
Hide all widgets
Just below the pin is an eye icon — the "hide all widgets" toggle. It hides every widget on the current page in one click, leaving just the headline tables and scorecards. Useful when you want to focus on raw rows without distraction. The deep dive lives in Showing and Hiding Widgets.
Search
Next is a Search button. Click it (or use the keyboard shortcut below) to open the global search overlay, which jumps you to any job by number or name. See Global Search.
Cmd+K on Mac or Ctrl+K on Windows opens search from any page in the app. It's the only global keyboard shortcut, and the fastest way to jump between jobs. The full list lives at Keyboard Shortcuts.
Three nav items
Below Search are the three primary pages. They're always in this order:
| Item | What it is |
|---|---|
| All Jobs | The main jobs table — every active job in the system |
| Action Queue | Your daily triage — POs waiting on you and missing cost codes |
| Analytics | The portfolio view — trends and totals across all jobs |
These three are the entire main navigation. There is no fourth top-level page.
Your account
At the bottom of the sidebar is a circle with your initials. Click it for the Sign out link. That's also where you go to leave the dashboard on a shared computer.
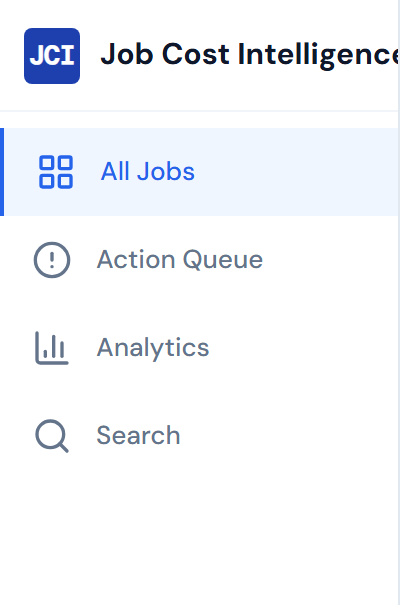
How you know which page you're on
The active nav item is highlighted with a subtle blue background tint and a colored left border in the brand blue. The other items stay in their default unselected state. Glance at the sidebar at any time and you'll see which page you're currently viewing.
The top filter bar
Above the page content is the filter bar. Some controls live there on every page that supports them, others appear only when relevant.
The fixtures you'll see most often:
- Company filter — narrow the data to one or more of the eight operating companies
- PM filter — narrow to a specific PM (when you're not using My Jobs)
- My Jobs toggle — the on/off switch that scopes everything to your jobs
Different pages can add their own controls here too — a date range on Analytics, a status filter on Action Queue, and so on. The shape of the filter bar is page-driven, but the My Jobs toggle is consistent everywhere it appears. See My Jobs vs. All Jobs for what the toggle does.
The main content area
The space to the right of the sidebar and below the filter bar is where each page's actual content renders — tables, charts, scorecards, and widgets. This area is where you spend most of your time.
Most pages are organized as a stack: scorecards on top, then widget cards, then a detail table at the bottom. You can hide individual widgets per page (or every widget at once with the eye toggle in the sidebar) to make the page feel as dense or as airy as you want.
The status indicator
Near the top of the content area you'll see a small status indicator that reads "Live ← BigQuery." That label tells you the dashboard is connected to the cost data store.
Numbers in JCI refresh on a four-hour cycle. "Live" means the data is wired through — it does not mean the moment a PO is entered, you see it. Source data feeds in nightly, with rollups refreshing every four hours. See Data Refresh Rates for the full schedule.
On a phone or tablet
The dashboard is desktop-first. If you open it on a phone or a narrow window, the layout shifts:
- The left sidebar is replaced by a header at the top with a hamburger menu and the current page title
- A bottom navigation bar appears at the bottom of the screen with the three primary pages
- Widgets and tables stack vertically instead of sitting side by side
The same data is there, but the chrome adapts. The full picture is at Mobile Behavior.
What's next
You know the chrome. Now read My Jobs vs. All Jobs to understand the single most-used filter in the dashboard, or jump back to Your First Five Minutes for the quick guided tour.