Job Detail — Overview
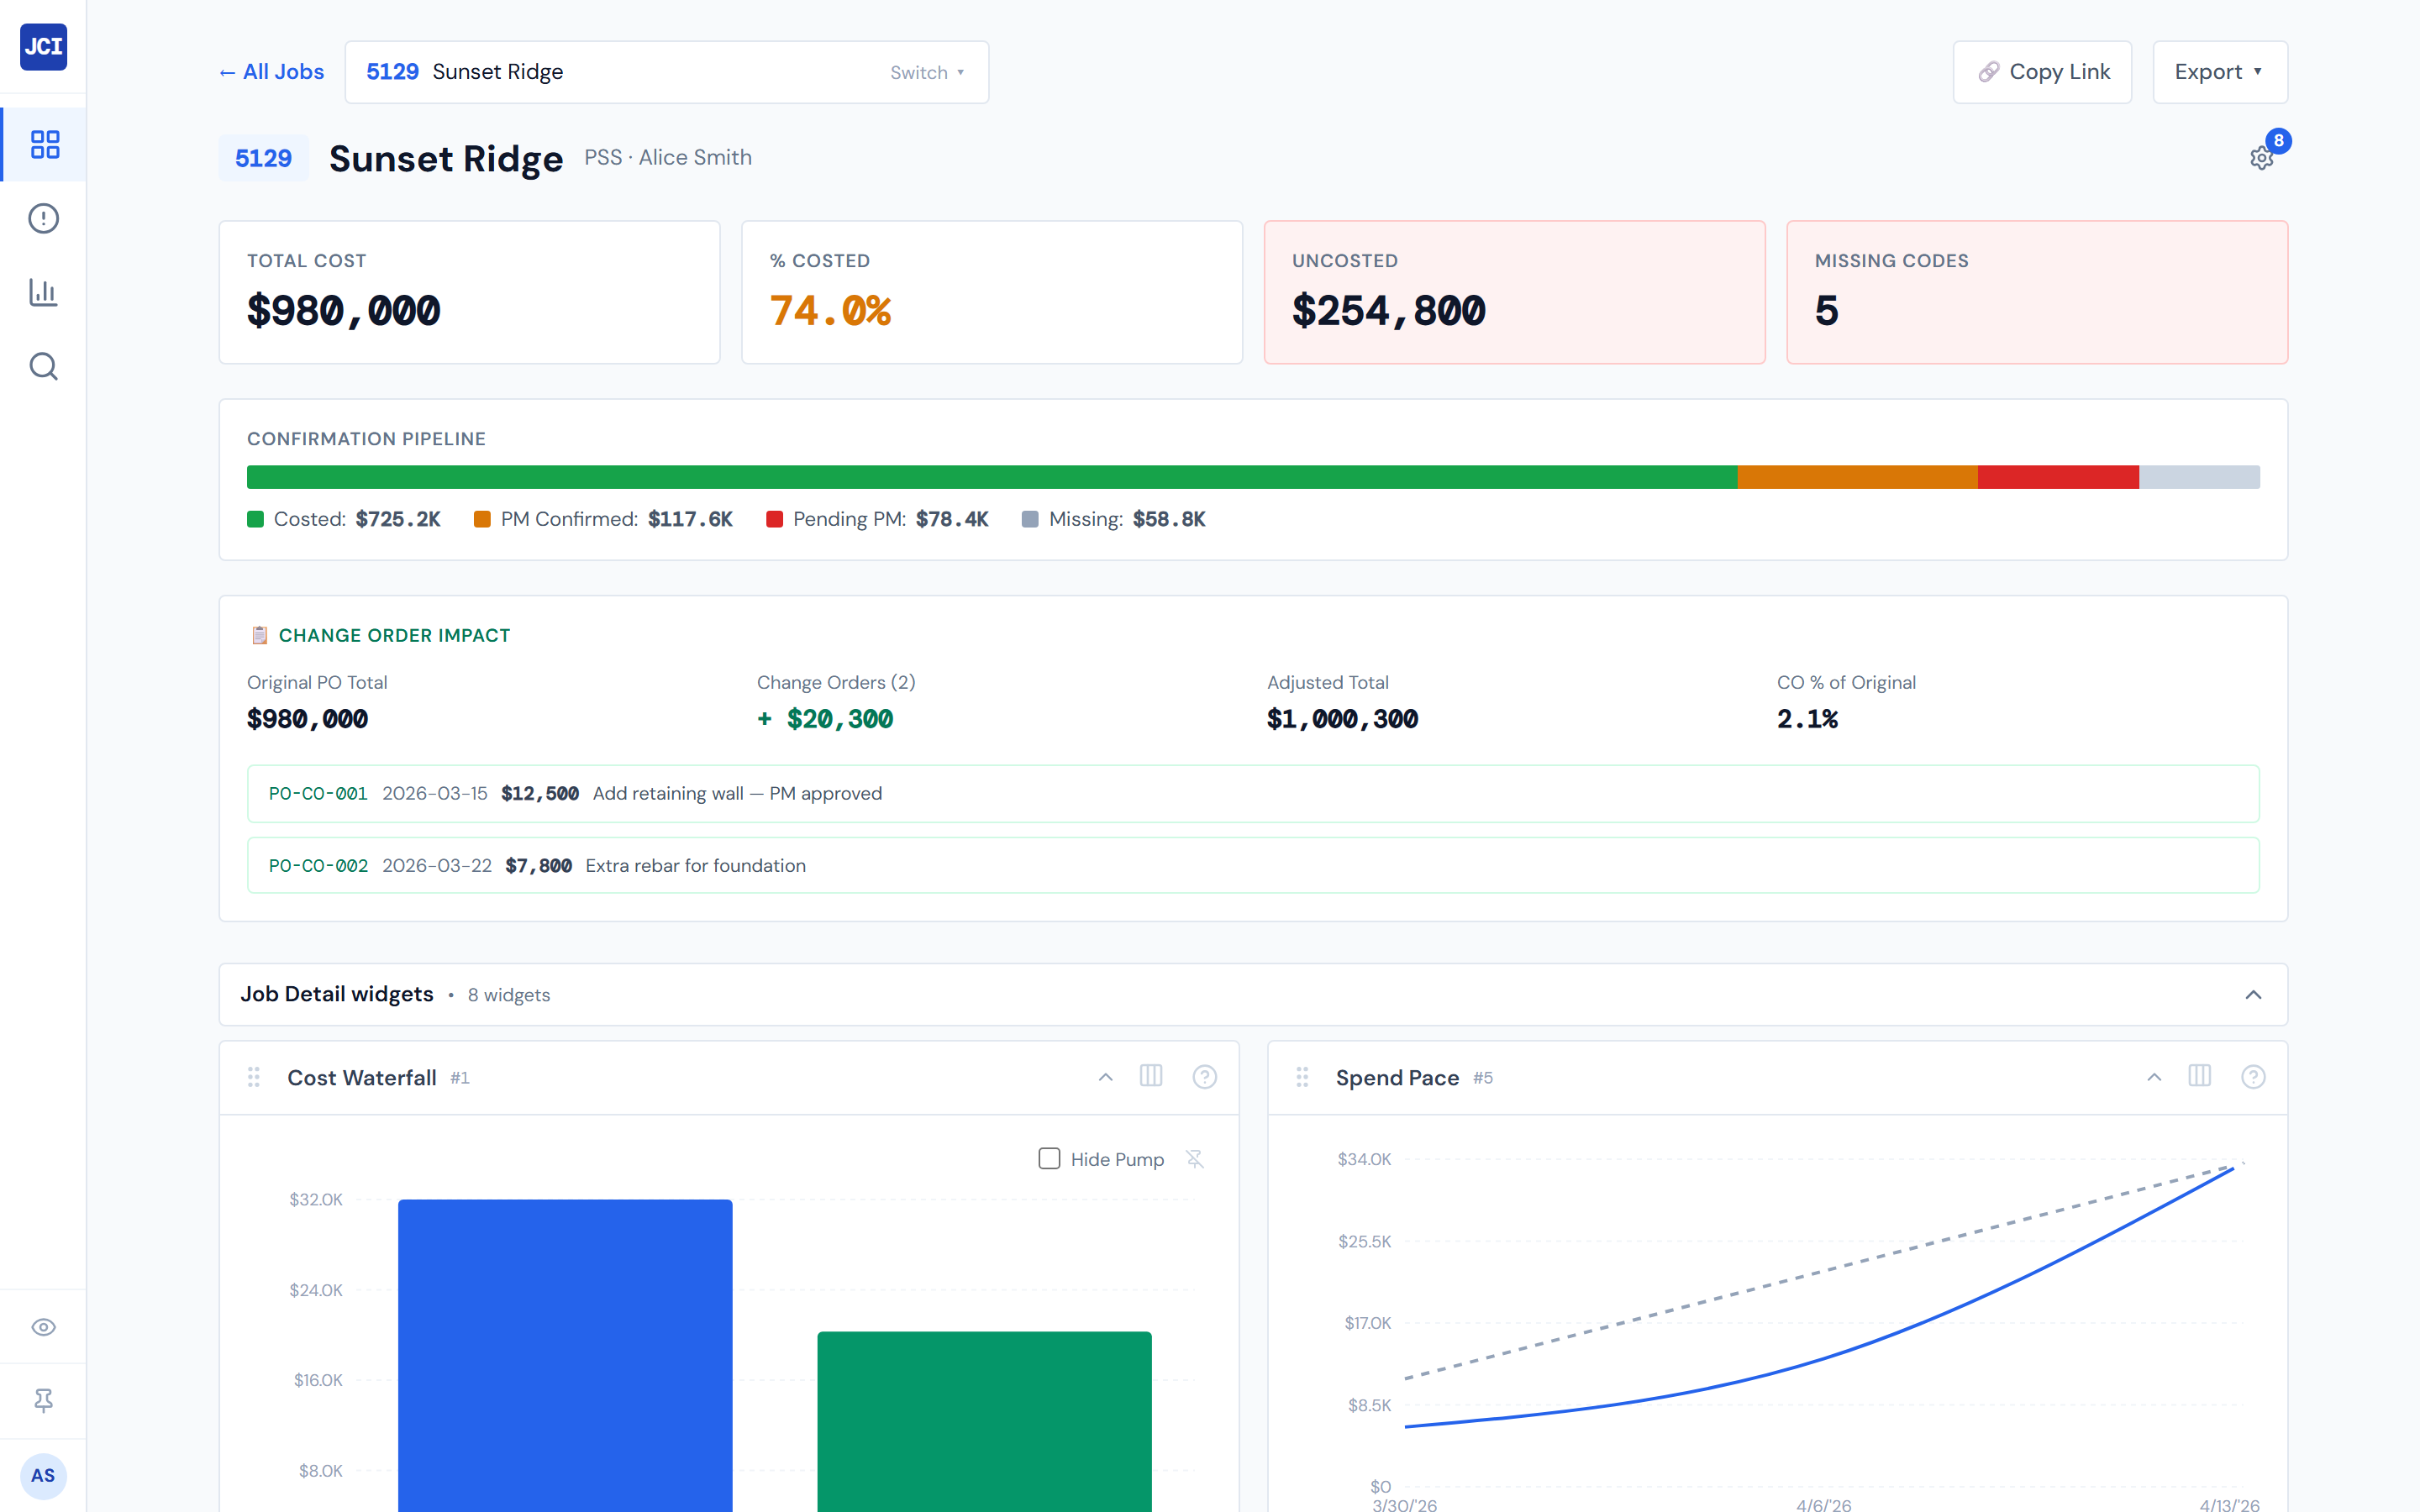
When you open a job, the page is laid out the same way every time. There's an action bar at the very top, a header strip with the job's vital stats, four scorecards, an always-visible Confirmation Pipeline card, an optional Change Order banner, a row of widgets, and then five tabs that hold all the detail. This page is the map. Each region links out to its own page where you can drill in.
Treat this as the index. If you want to use a region, click through to its sibling page.
The action bar
A thin row pinned to the top of the page. From left to right:
- ← All Jobs — goes back to the table you came from.
- Job Selector — a search-and-pick control for jumping to another job without leaving this page. It's the fastest way to bounce between jobs you're working on. See Switching Jobs.
- Copy Link — copies the current URL to your clipboard. The URL captures the active tab, so you can paste it into Slack and the recipient lands exactly where you were.
- Export — drops a menu with PDF, CSV, and Email Report options.
The header strip
Directly below the action bar. The monospace job-number chip in brand blue is the first thing you see, followed by the job name in bold. Lighter gray text underneath shows the company and the PM. On the right, a settings gear opens the widget panel — what's inside changes depending on the active main tab.
The header is covered in detail on Header & Scorecards.
The four scorecards
A row of four tiles directly below the header:
- Total Cost — sum of resolved PO costs on the job.
- % Costed — what fraction of Total Cost has been finalized by accounting. Color-coded.
- Uncosted — Total Cost minus Costed Cost in dollars. Outlined red whenever it's not zero.
- Missing Codes — count of labor lines without a cost code. Outlined red whenever it's nonzero.
Full anatomy lives on Header & Scorecards.
The Confirmation Pipeline card
A single horizontal status bar beneath the scorecards. It splits the job's Total Cost across four buckets: Costed (green), PM Confirmed (amber), Pending PM (red), and Missing (gray). Below the bar, the same four legend items appear with their dollar totals.
This card is always visible — every job has one.
The Confirmation Pipeline rolls up the Confirmed (Blue) and Accounting Costed (Green) PO statuses into a single Costed bucket because both mean "no further PM action." The PO Detail tab shows them as separate colors. So this card has four buckets but PO Detail uses five colors. See PO Lifecycle Colors for the full legend.
The Change Order banner (conditional)
Inserted between the Confirmation Pipeline card and the widgets area, but only if this job has at least one Change Order. Most jobs in the system don't have COs, so most of the time you'll never see this banner — that's normal.
When it's there, it shows the original PO total, the change order count and dollar contribution, the adjusted total, and the CO percentage of the original. See Change Orders.
The Change Order banner is conditional. If this job has no COs, you won't see it — and that's expected, not a bug. Most jobs in the dashboard have zero COs.
Widgets
A row of small charts and tiles that sit between the Change Order banner and the tab bar. Widgets are configurable per page — open the gear icon in the header to pick which ones show up.
The widget set changes with the active main tab. Field Data and Budget have their own widget surfaces, separate from the default Spend Analytics view. So if you switch from Spend Analytics to Field Data and the widgets above the tab bar look different, that's by design.
For the catalog and how to configure widgets, see the Widgets chapter.
The five main tabs
In screen order, left to right:
| Tab | What it shows | Read more |
|---|---|---|
| Spend Analytics (default) | Weekly stacked area + monthly stacked bar + a category pie. | Spend Analytics Tab |
| Category Cards | One card per category with activity, with status breakdown. | Category Cards Tab |
| PO Detail | The full purchase-order table, filterable and expandable. | PO Detail Tab |
| Field Data | Seven sub-tabs covering Cost Codes, Equipment, Fleet, Subs, Crew/Labor, Daily Reports, and Weather. | Field Data Tab |
| Budget | Three sub-tabs: Entry, vs Actual, and Billing. | Budget Tab |
The order is fixed. If you ever see a tab named something else here ("Summary," "Overview"), you're on a different page.

The tab bar is sticky
Once you start scrolling, the main tab bar pins to the top of the viewport so you can switch tabs without losing your scroll position. Field Data and Budget add their own sub-tab bars that pin just below the main tab bar — same idea, one level deeper.
The active tab is in the URL
Whichever tab you're on, the page URL ends with ?tab=... for that tab. Two consequences:
The active tab travels with the URL. If you're on PO Detail and you copy the link, the recipient lands on PO Detail too. The Copy Link button in the action bar exists for this.
The Field Data sub-tab and Daily Reports date are also URL-encoded, which is how widgets like the Daily Report Calendar can deep-link straight to a specific report.
Numbers can be a few hours stale
The data on this page comes from materialized tables that refresh every four hours. So a freshly clocked-in labor entry won't show up until the next refresh. Don't read this page as "live to the minute" — pair anything that surprises you with a glance at Data Refresh Rates.
Tips
Click the closed selector or hit it with the mouse, then ↑ and ↓ move through results, Enter picks the highlighted one, Esc closes the dropdown. See Switching Jobs.
Related reading
- Header & Scorecards — the vital stats up top
- Spend Analytics Tab, Category Cards Tab, PO Detail Tab, Field Data Tab, Budget Tab — one page per tab
- Change Orders — what the conditional banner is about
- Switching Jobs — the Job Selector in the action bar
- PO Lifecycle Colors — the five-color legend used on PO Detail
- Data Refresh Rates — why the page can be a few hours behind
- Widgets — the per-tab widget surfaces