Daily PM Routine
A typical PM day in JCI: sign in, triage the queue, glance at the portfolio, drill into anything that's flagged, close the page. This is the wider version of the Action Queue's morning routine — it places the queue inside the rest of the day.
The whole thing takes about ten minutes on a normal day. Longer when the queue is full or when something on the portfolio glance asks for a closer look.
How this page relates to the Action Queue's Daily Workflow
The Daily Workflow page in the Action Queue chapter is the in-queue routine — the five-step triage you run inside the queue itself, with a Mermaid flowchart of the decisions. This page is the same routine plus the surrounding context — what you do before you open the queue, and what you do after you've cleared it.
Daily Workflow has the in-queue Mermaid. This page has the wider day. They complement each other; you'll want both.
The five-phase day
1. Sign in (≈30 seconds)
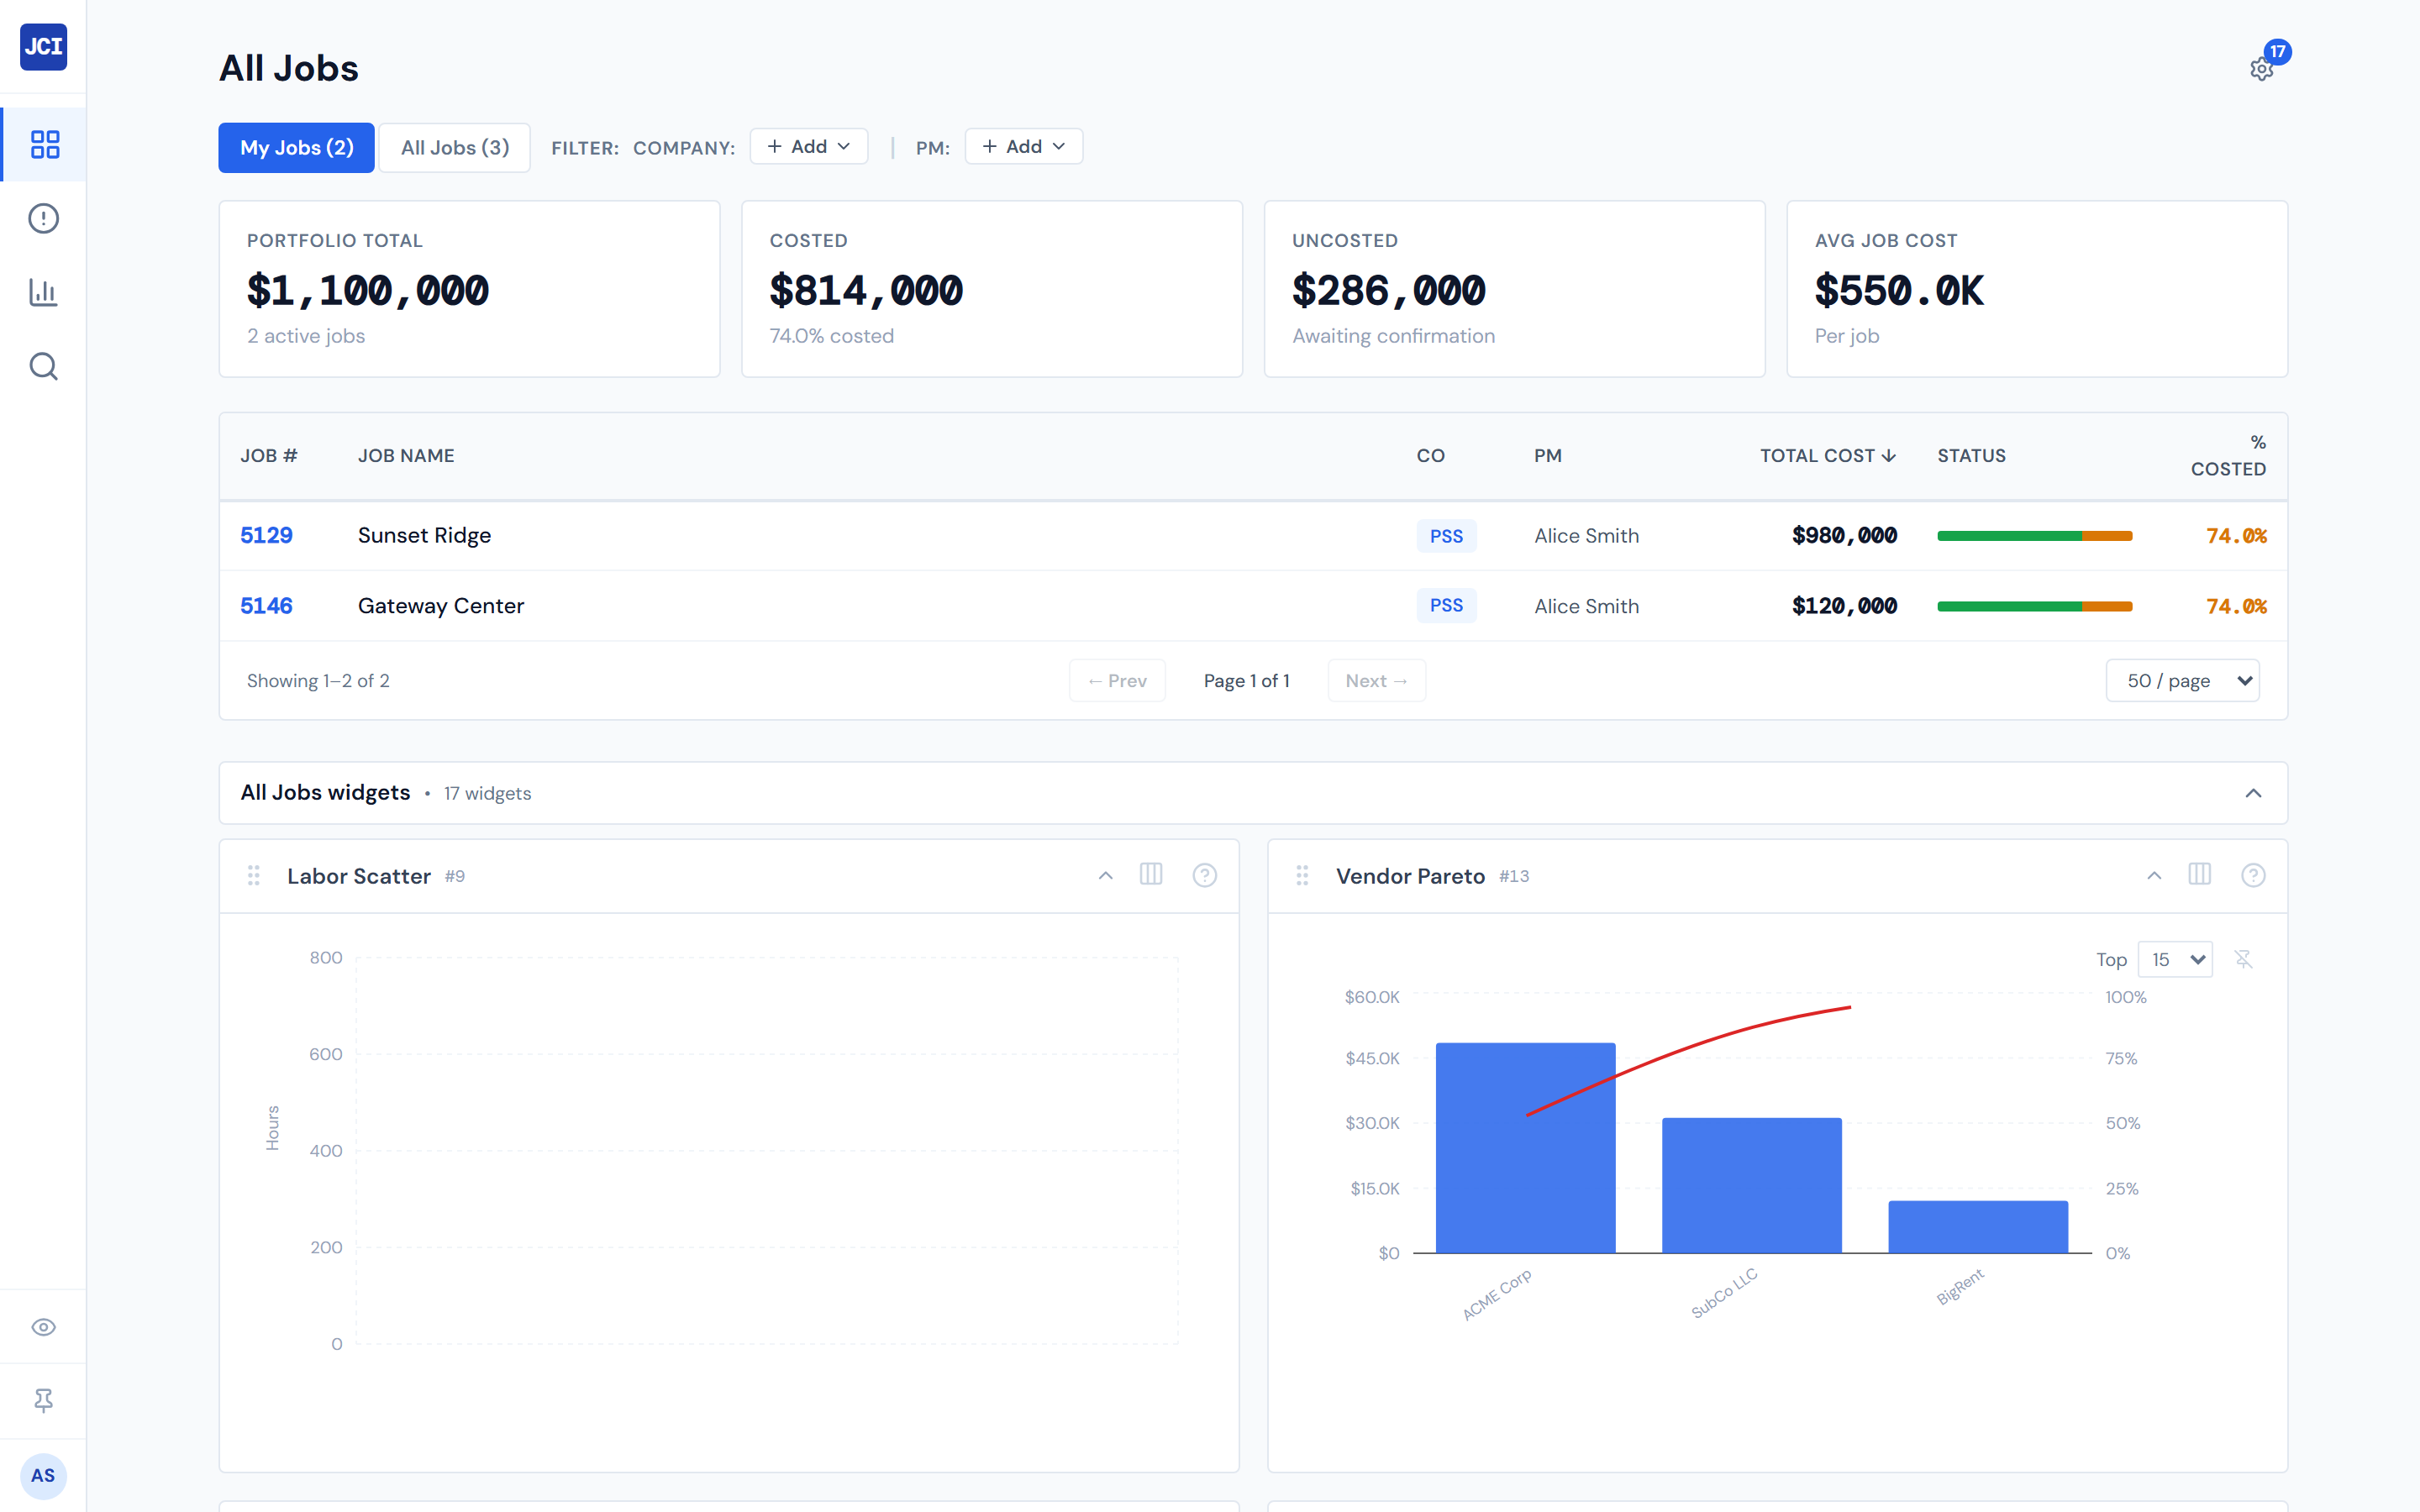
You'll land on All Jobs by default. If you're a PM, the My Jobs toggle is already on — you'll see your jobs only. If you're a viewer or office user, you'll see the full portfolio.
The full sign-in walkthrough lives at Signing In. The toggle behavior — including why it's a global, not per-page, setting — is at My Jobs Toggle.
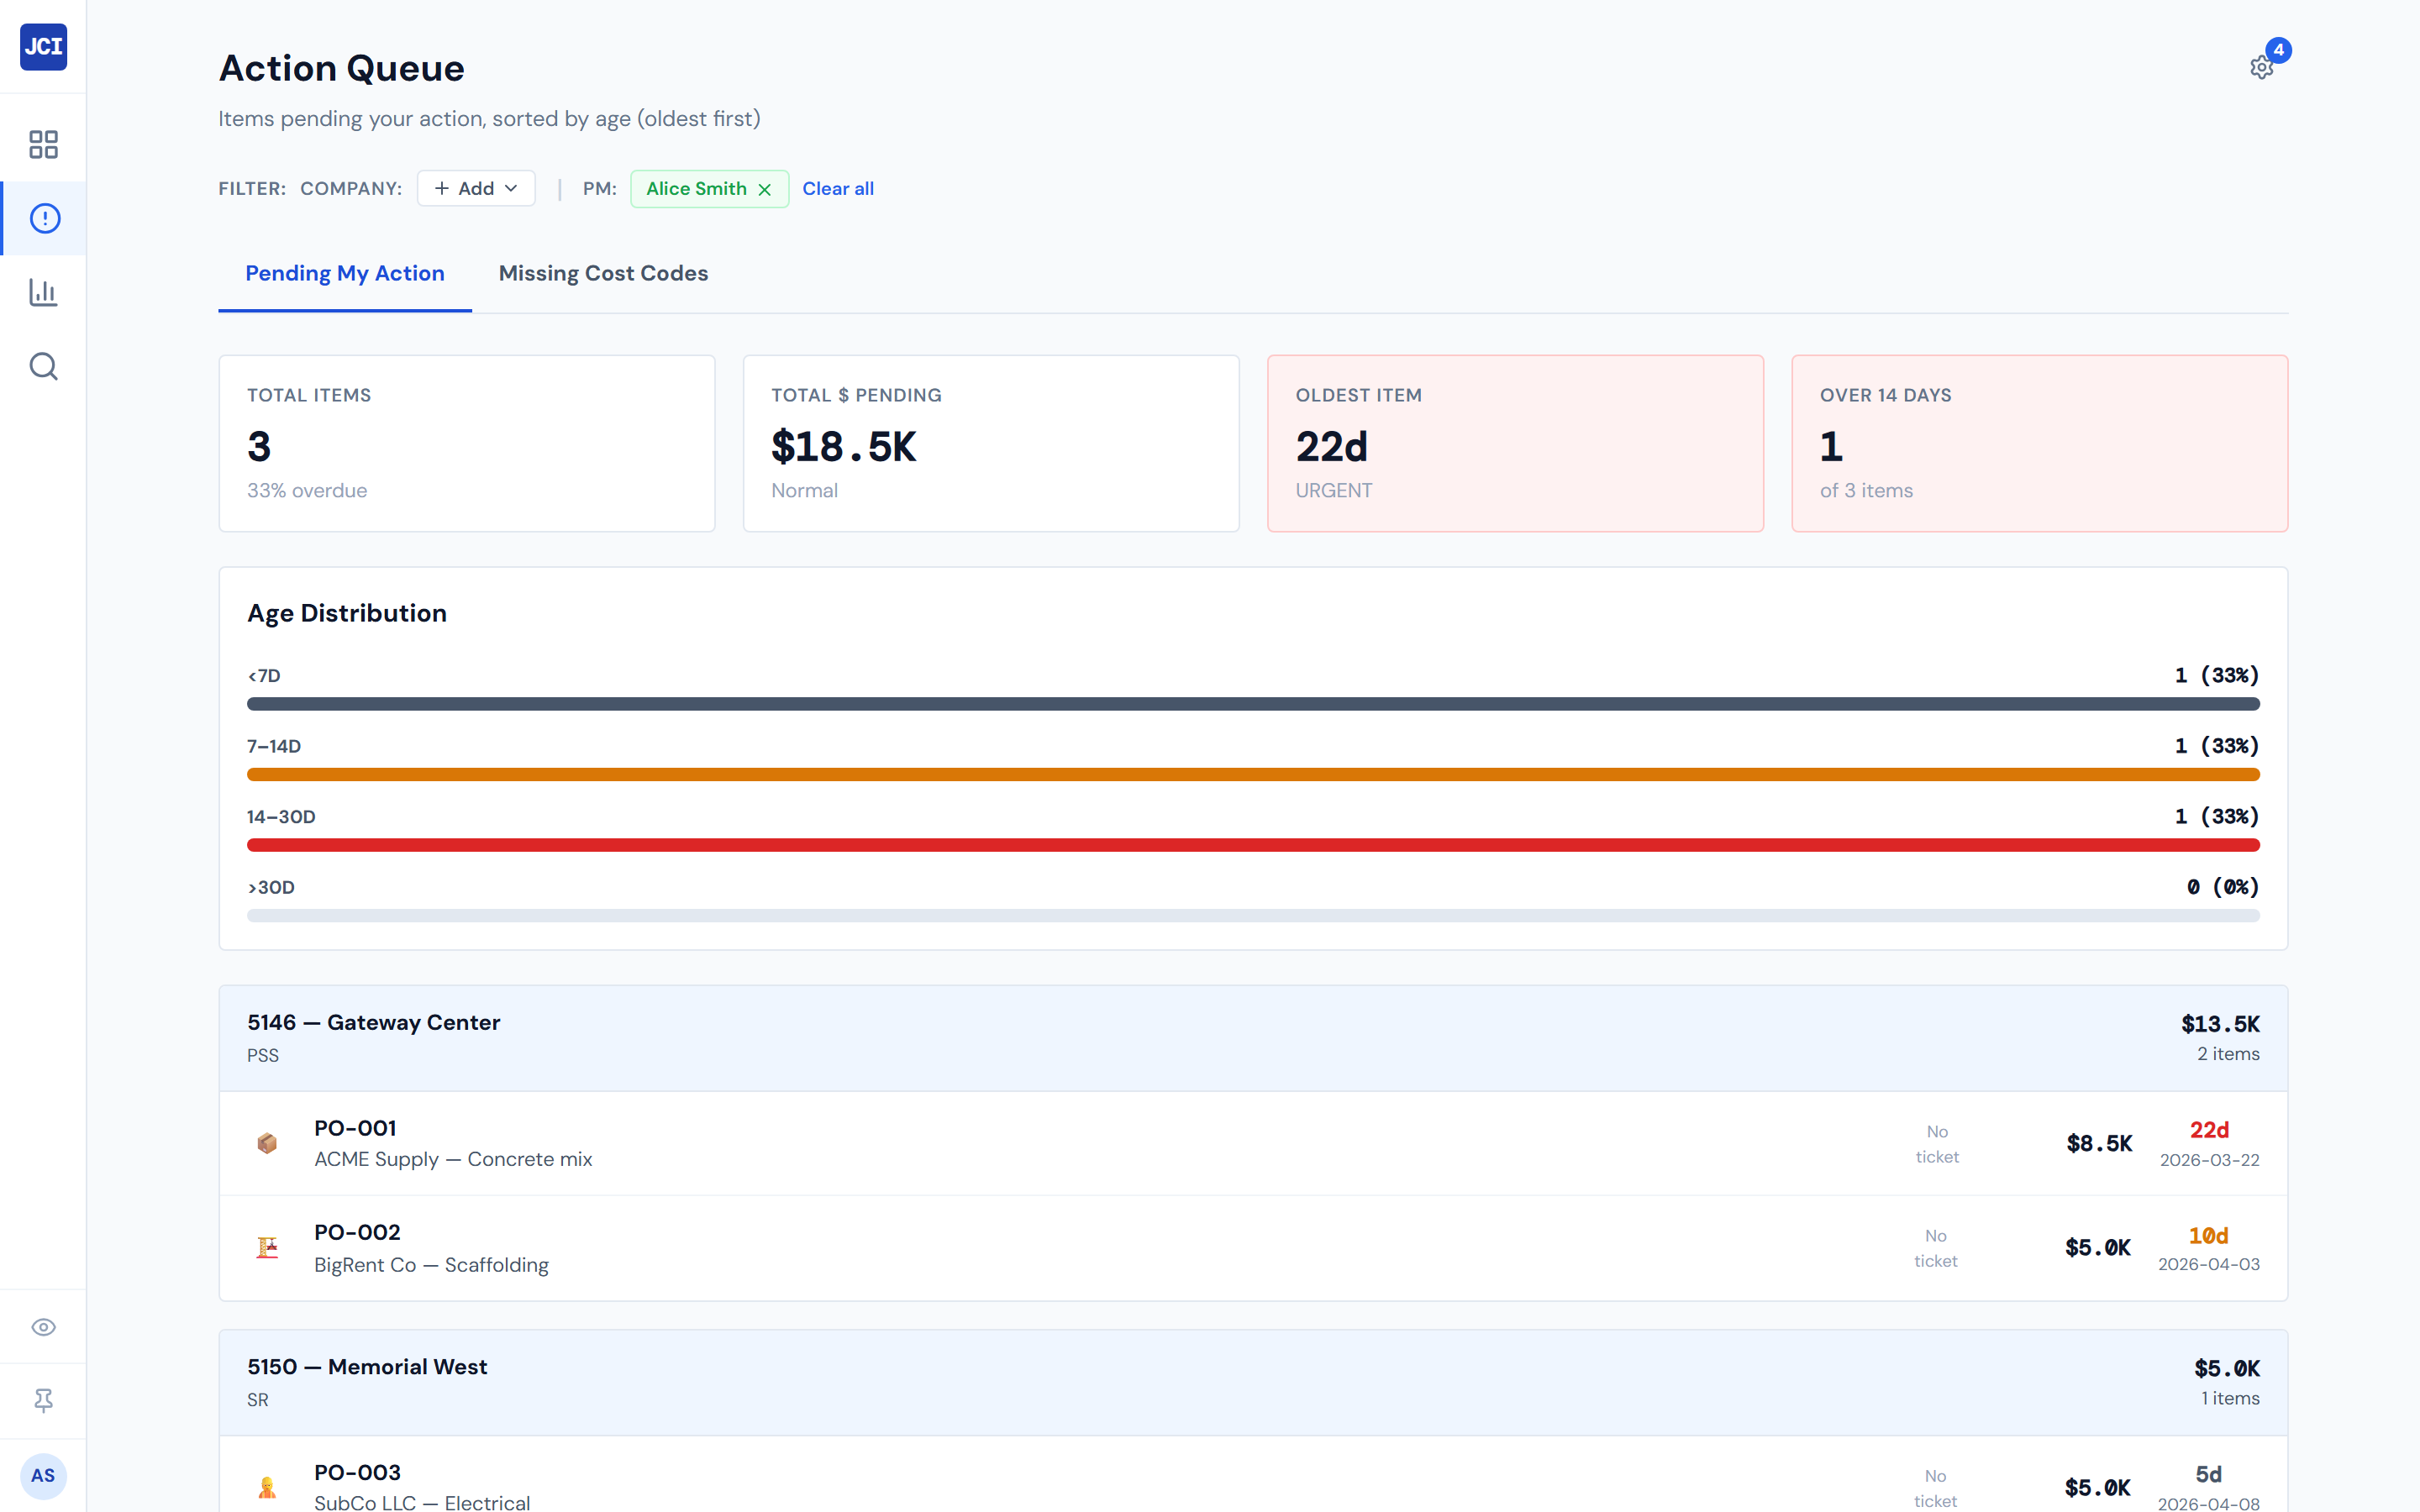
2. Triage the Action Queue (≈5 minutes on a normal day)
Click Action Queue in the sidebar — second item from the top. Work the Pending My Action tab top-down (oldest first). Switch to Missing Cost Codes and scan top-down (newest first — the sort is intentionally the opposite of Pending, because fresh labor entries are easier to attribute).
The Action Queue does the heavy lifting of "what needs my attention now." If the queue is empty, you're not blocked on anyone — proceed to the portfolio glance.
The full in-queue routine, including the decision flowchart, is at Daily Workflow. The chapter intro is at Action Queue Overview. For what red items mean, see Pending My Action. For the labor-only fix tab, see Missing Cost Codes.
3. Glance at Analytics for portfolio shape (≈2 minutes)
Click Analytics in the sidebar. Look at three things:
- The four scorecards at the top — Portfolio Total, Active Jobs, Peak Week, Average Weekly Spend.
- The Weekly Portfolio Spend area chart — is the trend line steady, climbing, or falling?
- The Costing Health bars — any category red or amber across the portfolio? That tells you which category to be alert about today.
You're not making decisions here; you're calibrating. The chapter intro is at Analytics Overview; the scorecards and area chart live at Portfolio View; the honest drilling story is at Drilling into a Job.
4. Drill into anything that's flagged (variable time)
If the Costing Health bars or the Action Queue surfaced a specific job, open it. Use Cmd/Ctrl+K to search by job number, or pick the job off the All Jobs table.
From Job Detail, the four tabs you'll most often glance at:
- Spend Analytics — pie, area, bar charts, plus Spend Pace if you've added it.
- Budget → vs Actual — variance rows, sorted worst-over-budget first.
- PO Detail — every PO with its lifecycle status.
- Field Data → Daily Reports — what the foreman filed yesterday.
If you click PM Leaderboard on Analytics to add a PM chip, that chip stays on Analytics. Navigating to All Jobs starts you fresh — re-apply the filter on the destination page if you want to take it with you, or use Copy Link to capture the current URL. See Drill-down Chips and the Filter Banner for the full story.
5. Close the page (≈30 seconds)
Mental checklist before you tab away:
- Did I act on every red queue item I could?
- Do I know which jobs are flagged for follow-up?
- Is there anything I need to take to my ops lead, the timeclock data owner, or the customer today?
If yes to any of those, you have follow-up work outside JCI. If no, the dashboard is clean for the day.
Cadence
Daily on a busy week. Twice a week minimum. The whole routine is roughly ten minutes on a normal day, longer when the queue is full or a portfolio glance surfaces something that needs investigation. Run it less often than twice a week and the queue starts to accumulate items older than fourteen days, which makes the next visit longer.
Longer when the queue is full or the portfolio surfaces something. Don't budget more — the routine is supposed to be a daily anchor, not a meeting.
End-of-day vs. start-of-day
Most PMs run this routine in the morning, when the day's data has refreshed since the previous evening. Some PMs run it again at end of day to confirm any actions they took during the day have been picked up.
Numbers refresh every four hours. An action you took at 2 PM may not appear in the queue until around 6 PM. If you ran the routine in the morning, an end-of-day check is optional, not required. See Data Refresh Rates for the full cadence.
What NOT to do during the routine
A short list of anti-patterns:
- Don't refresh-and-rage. Numbers refresh every four hours. A PO you confirmed thirty minutes ago is still going to show up in your red queue until the next refresh cycle. See Data Refresh Rates.
- Don't try to view another PM's queue. The queue is hard-scoped to your user account at the data layer. There's no affordance to view another PM's queue from JCI; coordinate OOO coverage outside the dashboard. See Action Queue Overview.
- Don't try to confirm POs from JCI. PO state changes happen in Purchase Ordering. JCI shows what's pending and lets you read the ticket; the actual confirmation lives elsewhere. See Confirming a PO.
- Don't try to edit Change Orders from JCI. CO records live in the daily-report AppSheet app — the same tool foremen use to file daily site reports. JCI shows impact only. See Reviewing a Change Order.
- Don't expect drill-down chips to follow you across pages. If you click PM Leaderboard on Analytics to add a PM chip, that chip stays on Analytics. Navigating away starts you fresh. See Drill-down Chips.
Numbers refresh every four hours. Confirm a PO, then move on — it'll clear from the queue on the next cycle.
What "done" looks like
You closed the page knowing:
- Every red item in your queue was triaged — confirmed, or noted-and-escalated.
- Any portfolio-level red signals were investigated or noted.
- You have a list of follow-ups outside JCI for anything that requires action elsewhere — Purchase Ordering, the timeclock app, the daily-report app, a customer conversation.
The dashboard's job is to surface what needs attention. Your job is to act on it. When the actions live in another tool, the dashboard's job is to send you there cleanly — not to do the action itself.
Optional: the Anomaly Feed
The Action Queue does the work of surfacing what's pending. Some PMs add the Anomaly Feed widget to Analytics for a top-of-mind list of unusual patterns — sudden spend spikes, vendor concentration, that sort of thing. It's opt-in. It does not replace the manual queue triage in step 2; it surfaces additional candidates worth a look. See Alert Widgets.
Mobile
This routine is written for a PM at a desk. The mobile experience exists but isn't optimized for triage — the queue table compresses awkwardly on narrow screens, and lightboxes can be fiddly with one hand. See Mobile Behavior for the honest picture.
What's next
- New to the dashboard? Start with First Five Minutes — the new-PM variant of this routine.
- Hitting an overrun on a job during step 4? See Spotting Overruns for the deeper investigation.
- A PO surfaced in your queue and you need to act on it? See Confirming a PO.
- Cost code missing on a labor entry? See Fixing a Missing Cost Code.
- End of the month? See Month-End Review.