Your First Five Minutes
A guided five-step tour of the dashboard. Follow it once, top to bottom. By the end you'll know where every major feature lives, and coming back later will feel familiar.
Takes about five minutes. You won't have to memorize anything — just see each region of the app once so you know where to look later.
Step 1: Sign in
Open dash.precisionsiteservices.com and click Sign in with Google. Pick your work account.
When the page loads, you're on All Jobs, with your initials in the bottom of the sidebar. That's the end state for this step. If anything went wrong — wrong account, unauthorized domain — see Signing In for the full walkthrough.
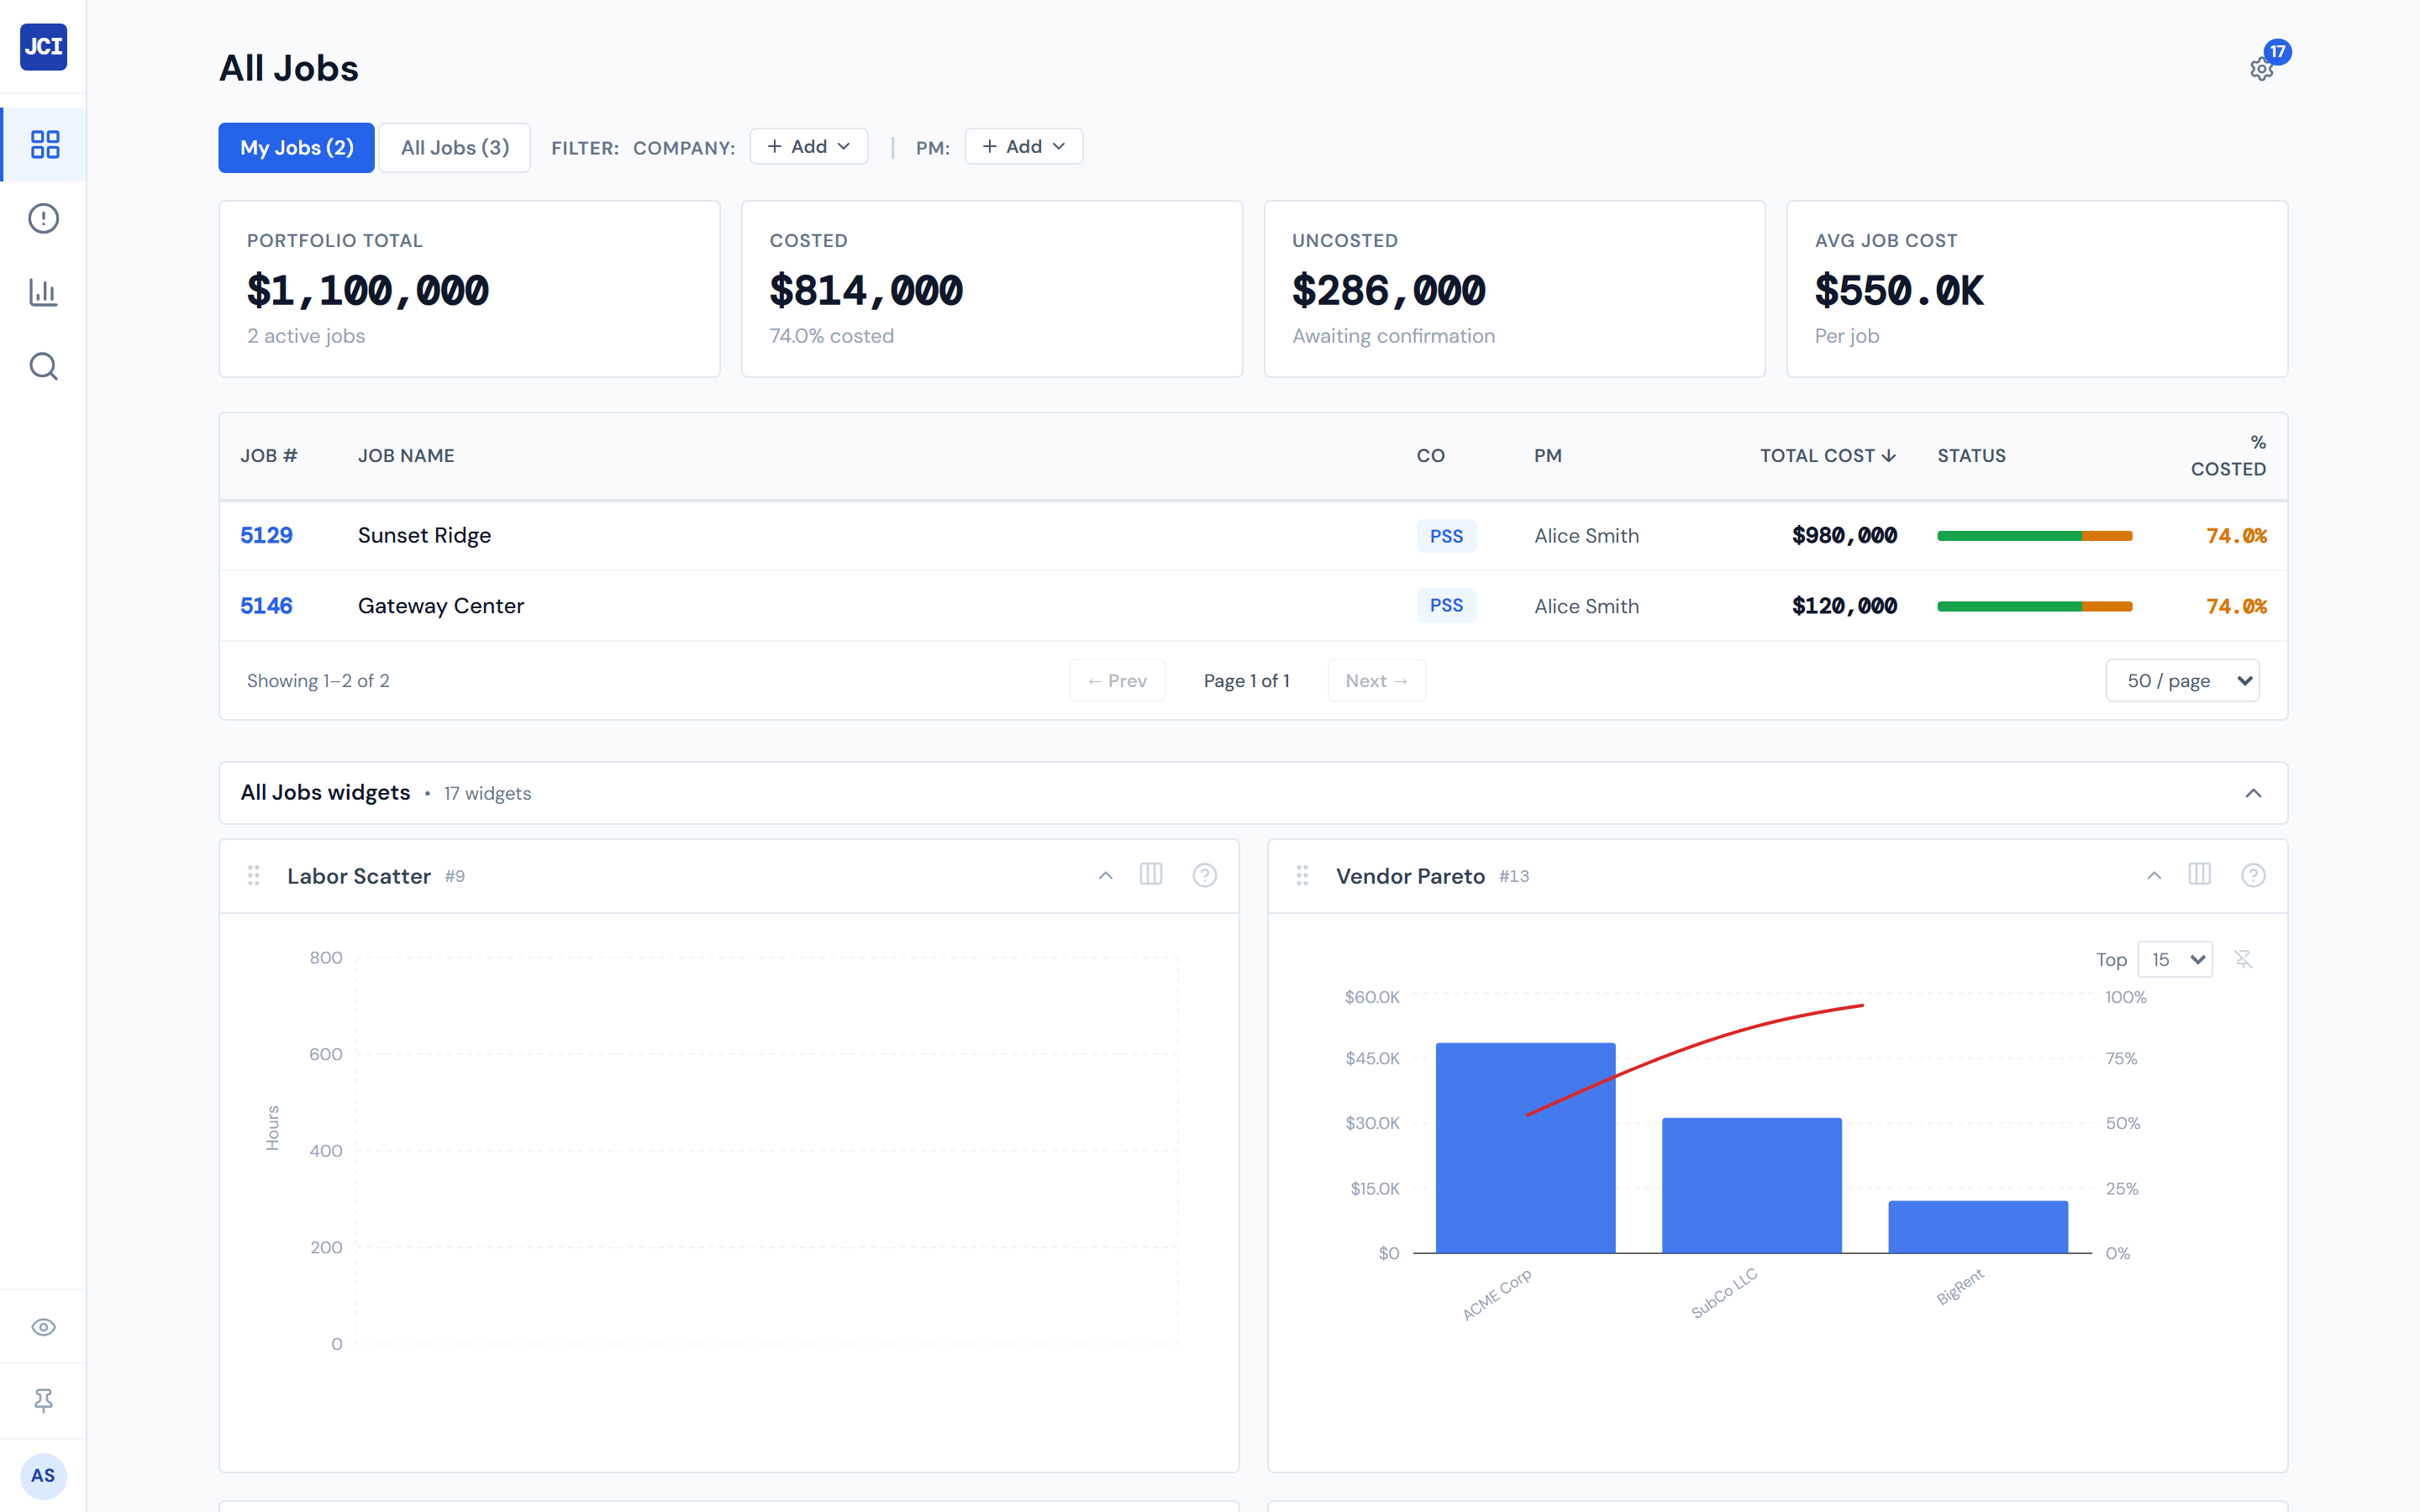
Step 2: Toggle My Jobs off, just to see
Find the My Jobs toggle in the top filter bar. It's on by default. Flip it off.
The table expands to show every active job across every company. This is the "wide view" — useful when you need to look up a job that isn't yours, help a peer, or check a sister-company project.
Flip the toggle back on to return to your scoped view.
If your table looks empty when My Jobs is on, that's worth knowing about — it can happen even for active PMs. The full explanation is in My Jobs vs. All Jobs.
Step 3: Open any job
Click any row in the jobs table. You land on Job Detail for that job.
At the top of the page you'll see the job header with scorecards — total cost, percent costed, and the like. Below that is a tab bar with five tabs:
- Spend Analytics
- Category Cards
- PO Detail
- Field Data
- Budget
Click each tab once to see what's there. You don't need to do anything — this is just orientation. The full walkthrough lives in Job Detail.
Step 4: Visit the Action Queue
Click Action Queue in the sidebar.
The Action Queue is your daily triage. It has two tabs:
- Pending My Action — POs that are waiting for you to confirm them
- Missing Cost Codes — labor and PO lines that don't have a cost code yet
If both tabs are empty, that's a good thing — it means nothing is stuck waiting on you right now. Even if it's empty today, bookmark this page's purpose. The deep walkthrough is in Action Queue.
Step 5: Glance at Analytics
Click Analytics in the sidebar.
This is the portfolio view: scorecards at the top summarizing total cost and job count across the whole portfolio, and a weekly spend trend chart below. Use it for the big-picture question: "How are all my jobs doing this month?" rather than "What's happening on this one job?"
The full chapter is at Analytics.
A note on freshness
The dashboard is fast, but it isn't quite live. The cost numbers and POs you see refresh on a four-hour cycle, and budgets you enter take a few minutes to flow through. If you entered something a few minutes ago and don't see it yet, that's normal — come back in a bit. See Data Refresh Rates for the full picture.
What to do next
You've seen the shape of the app. Here are the natural next reads, depending on what you're trying to do:
- Confirm a PO that came in: Confirming a PO
- Set up a budget on a new job: Entering a Job Budget
- Slow down and learn the chrome: The Interface