Portfolio View
The four numbers at the top of Analytics answer four questions about your whole portfolio at once: how much has been spent, how much of it is fully costed, how much is still open, and what the busiest single week looked like. The Weekly Portfolio Spend area chart directly below them paints the same story over time.
This page covers what each number means and how the filter row reshapes them. The range toggle on the area chart and the Monthly Spend by Company breakdown have their own page — see Trends and Weekly Spend.
% Costed turns green at 70% and above. Below 70% it stays amber. That's the only threshold to remember on this row.

The four scorecards
Portfolio Total
The sum of every dollar tracked on every job currently in scope. With My Jobs on, this is "the sum on your jobs." With one or more Company chips set, it's "the sum on jobs at those companies." The number is shown in neutral text — there is no threshold or color coding on this scorecard.
% Costed
The share of Portfolio Total that has reached either Confirmed (blue) or Accounting Costed (green) status. The scorecard turns green at 70% and above and stays amber below 70%.
Costed combines two PO statuses, not just one. It does not mean "the accounting team has booked the cost." Most portfolios show a high % Costed even before accounting has touched anything, because labor auto-confirms on clock-in and labor is the largest single category for most jobs. A high % Costed is a signal that dollars have moved past the PM's queue — not that they're audit-complete.
See PO lifecycle colors for what each status actually means.
Uncosted
Portfolio Total minus the costed share. The dollars that are still flowing through PM Confirmed (amber), Pending PM (red), or Missing Ticket (gray). Always shown in red so it's easy to spot at a glance — even when the actual amount is small, the color is consistent.
Peak Week
The highest single weekly spend total within the range currently shown on the Weekly Portfolio Spend area chart below. Switching the range toggle from 6M to 3M can drop the peak (because the historical high week is no longer in view). Switching to All can grow it.
Peak Week is range-dependent. A change in the number doesn't necessarily mean spending changed — it can mean the historical peak just isn't visible anymore. If Peak Week looks lower than you remember, check the range toggle on the chart below before chasing it. The toggle and the math behind it are documented in Trends and Weekly Spend.
Weekly Portfolio Spend
Directly below the scorecards is the Weekly Portfolio Spend area chart — a single line summarizing total dollars per week across all categories on all in-scope jobs.
- Each point on the X axis is one calendar week.
- The Y axis is total dollars for that week.
- Hovering on the chart shows the exact week and the exact total.
- The chart respects the same filters as the scorecards — chip in, chart redraws.
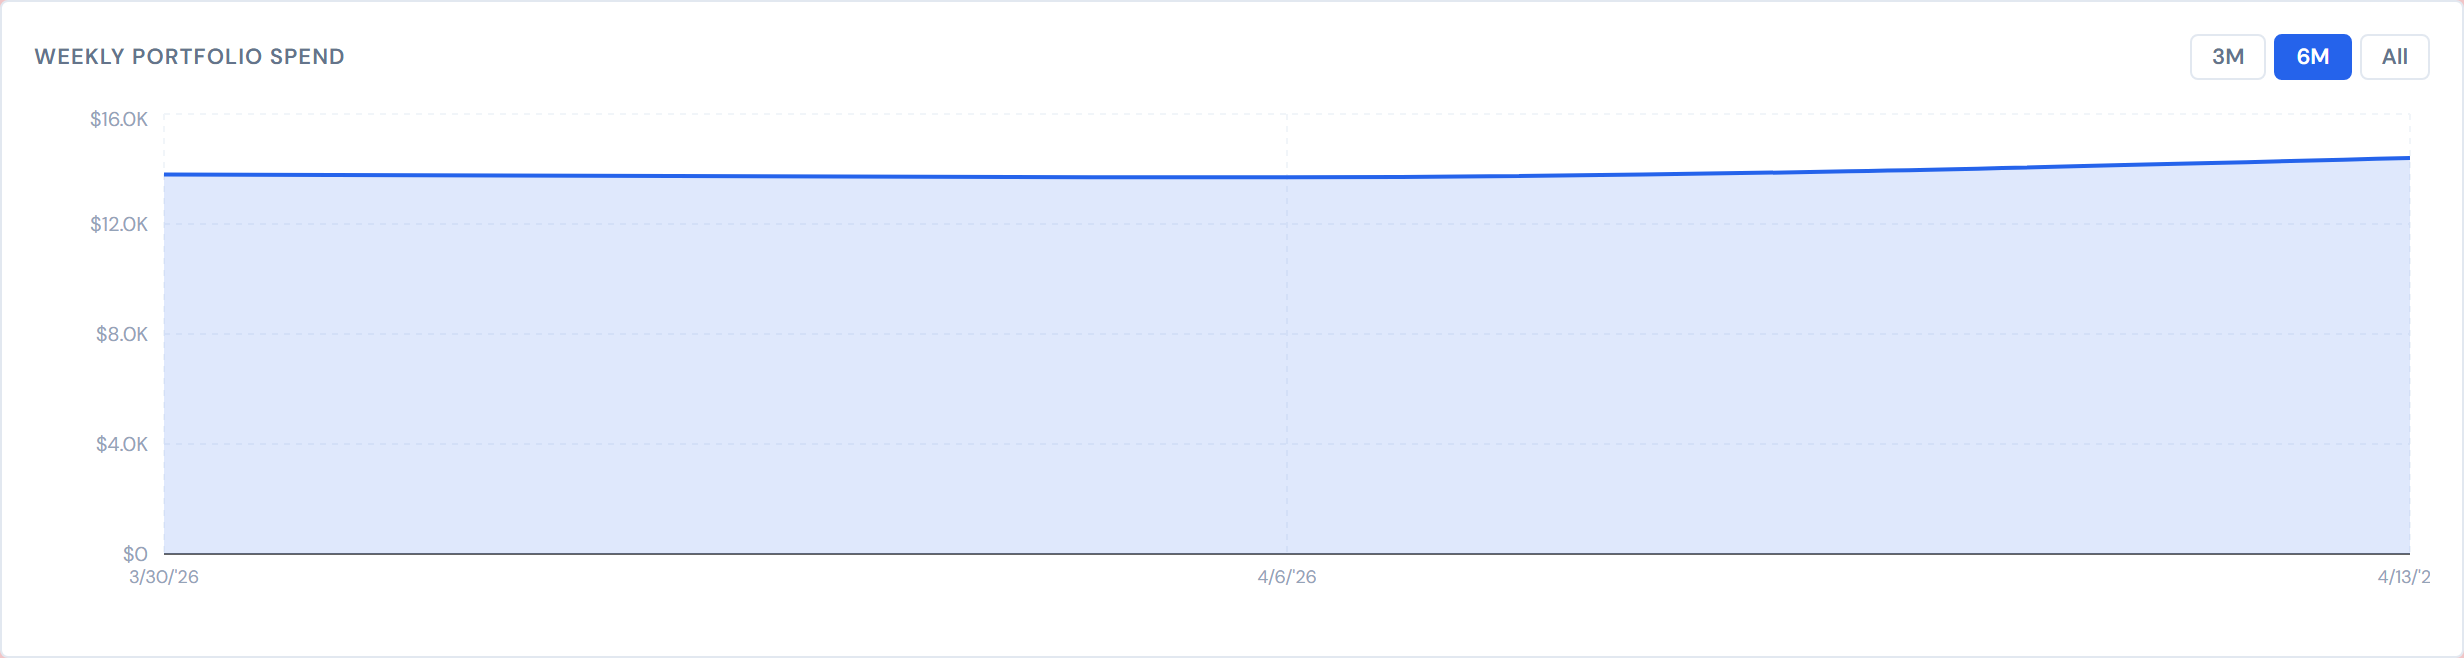
The 3M / 6M / All buttons to the right of the chart header control how far back the chart looks. They are covered in detail in Trends and Weekly Spend.
How filters reshape the whole row
Every change to the filter row above the scorecards re-runs the math on all four scorecards and refetches the weekly chart. Specifically:
- Adding or removing a Company chip.
- Adding or removing a PM chip.
- Clicking Clear all.
- Flipping the My Jobs / All Jobs toggle (PMs only).
There is no separate "apply" step. The page redraws as soon as the chip lands or the toggle flips. If you don't see the numbers move, the most likely explanation is that the change didn't actually narrow the scope (for example, adding a Company chip for a company you weren't excluding).
For chip mechanics, see Filter Banner and Company and PM filters.
My Jobs caveat
When My Jobs is on, the four scorecards and the area chart only count jobs where the signed-in PM is matched on user ID. Jobs whose PM field holds a free-text first name (instead of a user ID) will silently drop out of every number on the page.
This is the same caveat documented on My Jobs vs. All Jobs and on the All Jobs filter bar — it's the dashboard-wide behavior of the My Jobs toggle, not a quirk specific to Analytics.
Empty state
When filters narrow the page to no matching jobs:
- All four scorecards show $0, 0%, $0, and $0 respectively.
- The Weekly Portfolio Spend chart area shows the message "No weekly spend for the selected filters."
That's the empty state, not a broken page. Removing one or two chips usually brings the numbers back.
A few other things worth knowing
Numbers can be up to four hours stale. Tickets a PM uploaded recently may not appear in this row yet. See Data refresh rates.
Pump category contributes $0 to Portfolio Total. Pump costs are never populated in the source data, so they neither pull the total down nor lift the % Costed. Don't chase a missing pump line — there isn't one to find. (See Categories for the full category list.)
Related pages
- Trends and Weekly Spend — the 3M / 6M / All range toggle and Monthly Spend by Company.
- Drilling into a Job — Category Mix, Costing Health, and going from a chart to a specific job.
- PO lifecycle colors — what counts as "costed" and what doesn't.
- My Jobs vs. All Jobs — the toggle that scopes this page.
- Filter Banner — the chip controls.
- Data refresh rates — the four-hour lag.