Trends and Weekly Spend
Two views answer two questions. The range toggle on the Weekly Portfolio Spend area chart asks "how far back do I want to look?" The Monthly Spend by Company chart in the breakdown row asks "how is each company trending over the last several months?"
This page covers both. For the area chart's general shape and the four scorecards above it, see Portfolio View.
All shows every week of history the page has data for. Useful for finding the historical Peak Week or comparing this year's curve to last year's.
The 3M / 6M / All range toggle
Three buttons sit to the right of the Weekly Portfolio Spend header.
| Button | What it shows |
|---|---|
| 3M | The last roughly 13 weeks (about three months) of weekly totals. |
| 6M | The last roughly 26 weeks (about six months). This is the default on a fresh load. |
| All | Every week the page has data for, with no upper bound. |
The active button is highlighted in brand blue. Clicking another button switches immediately — there is no separate apply step.
![]()
What changes when you switch range
Three things move when you flip the toggle:
- The chart's leftmost weeks shift. The rightmost (most recent) week stays put — every range ends at "now."
- The X-axis tick density adjusts so labels don't collide. 3M shows individual week labels comfortably; All shows fewer, more spaced ticks.
- Peak Week recalculates against the new visible range. A peak from eight months ago will only appear in the All view.
What the range toggle does NOT change
This trips people up the first few times.
Switching the range only affects the area chart and the Peak Week scorecard. It does not change the Monthly Spend by Company bars, the Category Mix donut, or the Costing Health bars below. If you click 3M and the breakdown cards underneath stay the same, that's expected — they read a fixed window of their own.
Monthly Spend by Company
The first card in the breakdown row is Monthly Spend by Company — a stacked bar chart with one bar per month, segmented by company.
- The chart always shows the last 8 months, ending with the most recent month with any data.
- There is no widget control to widen the window — it's a fixed 8-month view.
- Hovering a bar segment shows the dollar total for that company in that month.
- The legend below the chart names the companies whose stacks are visible.
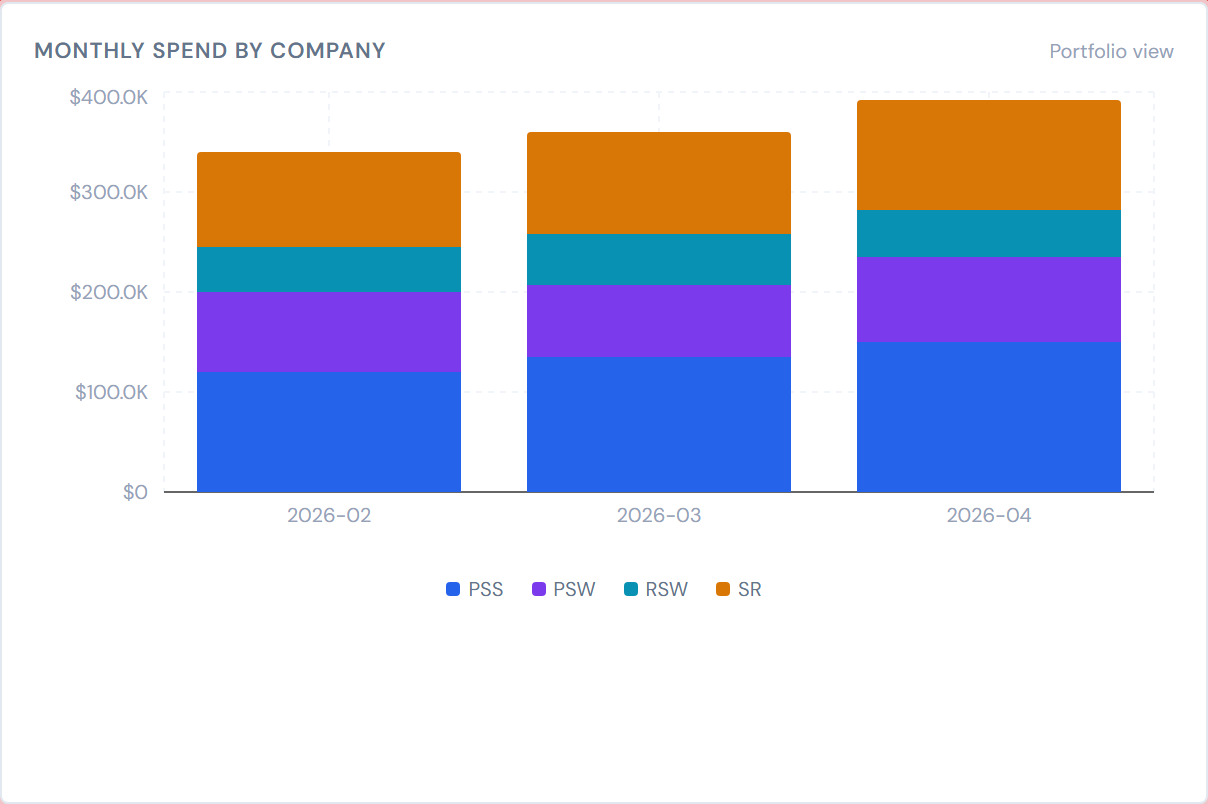
Only four companies render as visible stacks
This is the most surprising thing on the page.
Today the Monthly Spend by Company card stacks bars for PSS, PSW, RSW, and SR only. The other four companies — SRS, SITE DRYWALL, SRS PAINTING AND DRYWALL, and SRS AUSTIN — do not get a visible stack here, even though their spend is included in the page-level Portfolio Total scorecard.
If you work at one of those four hidden companies and expect to see your bar in this card, you will not find it. That's a known limitation of this card today, not a data error. The full company list lives at Companies and divisions.
There is no "+ N hidden" indicator on the card to surface this. A Company chip applied to one of the four hidden companies will shrink the visible bars to nothing — see the verification step below the warning.
How filters interact with both charts
Both the Weekly Portfolio Spend area chart and the Monthly Spend by Company card respond to the same filter row at the top of the page:
- Adding a Company chip narrows both charts to that company's data.
- Adding a PM chip narrows both to that PM's jobs.
- Flipping My Jobs scopes both to your jobs.
- Clear all re-broadens both at once.
Both charts also respect the same scope at the same time — there is no way to filter just one of them.
For chip mechanics, see Filter Banner and Company and PM filters.
My Jobs and the Monthly card
When My Jobs is on, the Monthly Spend by Company card shows a small "Portfolio view" hint near the card header. The card always groups by company even in My Jobs mode, because a single PM can have jobs across multiple companies — keeping the per-company breakdown still tells you something useful.
Where to go for deeper trend views
The Analytics page ships with seven optional widgets that surface trend angles the breakdown cards don't. Three of them in particular are useful when the area chart and monthly bars aren't enough:
- Month-over-Month Slope — the last 12 months of total portfolio spend as a single line, with a "Trending Up / Down" callout.
- Spend Trend Multiples — one small line chart per top company, with a shared-Y-axis option for fair comparison.
- Pipeline Funnel — a per-stage breakdown of POs (count or dollars) at each lifecycle stage.
All three are opt-in — none appear on a fresh account until you add them through the gear icon. They are documented as part of the Widget Catalog (see the Spend widgets and Portfolio widgets pages, plus Widgets overview for how the grid works).
If one of these widgets renders empty when you expect data, removing a filter chip or two often brings it back. A widget showing nothing under a narrow filter is a known shape, not a bug for you to file.
A few notes worth flagging
Numbers can be up to four hours stale. A ticket uploaded earlier today may not appear in the current week's bar yet. See Data refresh rates.
Pump category contributes $0 to every month. Pump costs are never populated in the source data, so the per-company stacks you're looking at don't include any pump spend. This won't change a stacked bar's visual height — pump is a category, not a company — but it's worth knowing if you compare JCI's totals to another report that handles pump differently.
Related pages
- Analytics Overview — the full page layout.
- Portfolio View — the four scorecards above the area chart.
- Drilling into a Job — Category Mix, Costing Health, and going from a chart to a job.
- Spend widgets catalog — Month-over-Month Slope, Spend Trend Multiples, and similar trend widgets.
- Portfolio widgets catalog — Pipeline Funnel and the other portfolio-shaped widgets.
- Companies and divisions — the full company list, including the four not stacked on this page's monthly card.
- Filter Banner — the chips that scope both charts.
- Data refresh rates — the four-hour lag.
- Glossary — definitions for Peak Week, Weekly Portfolio Spend, and other terms.