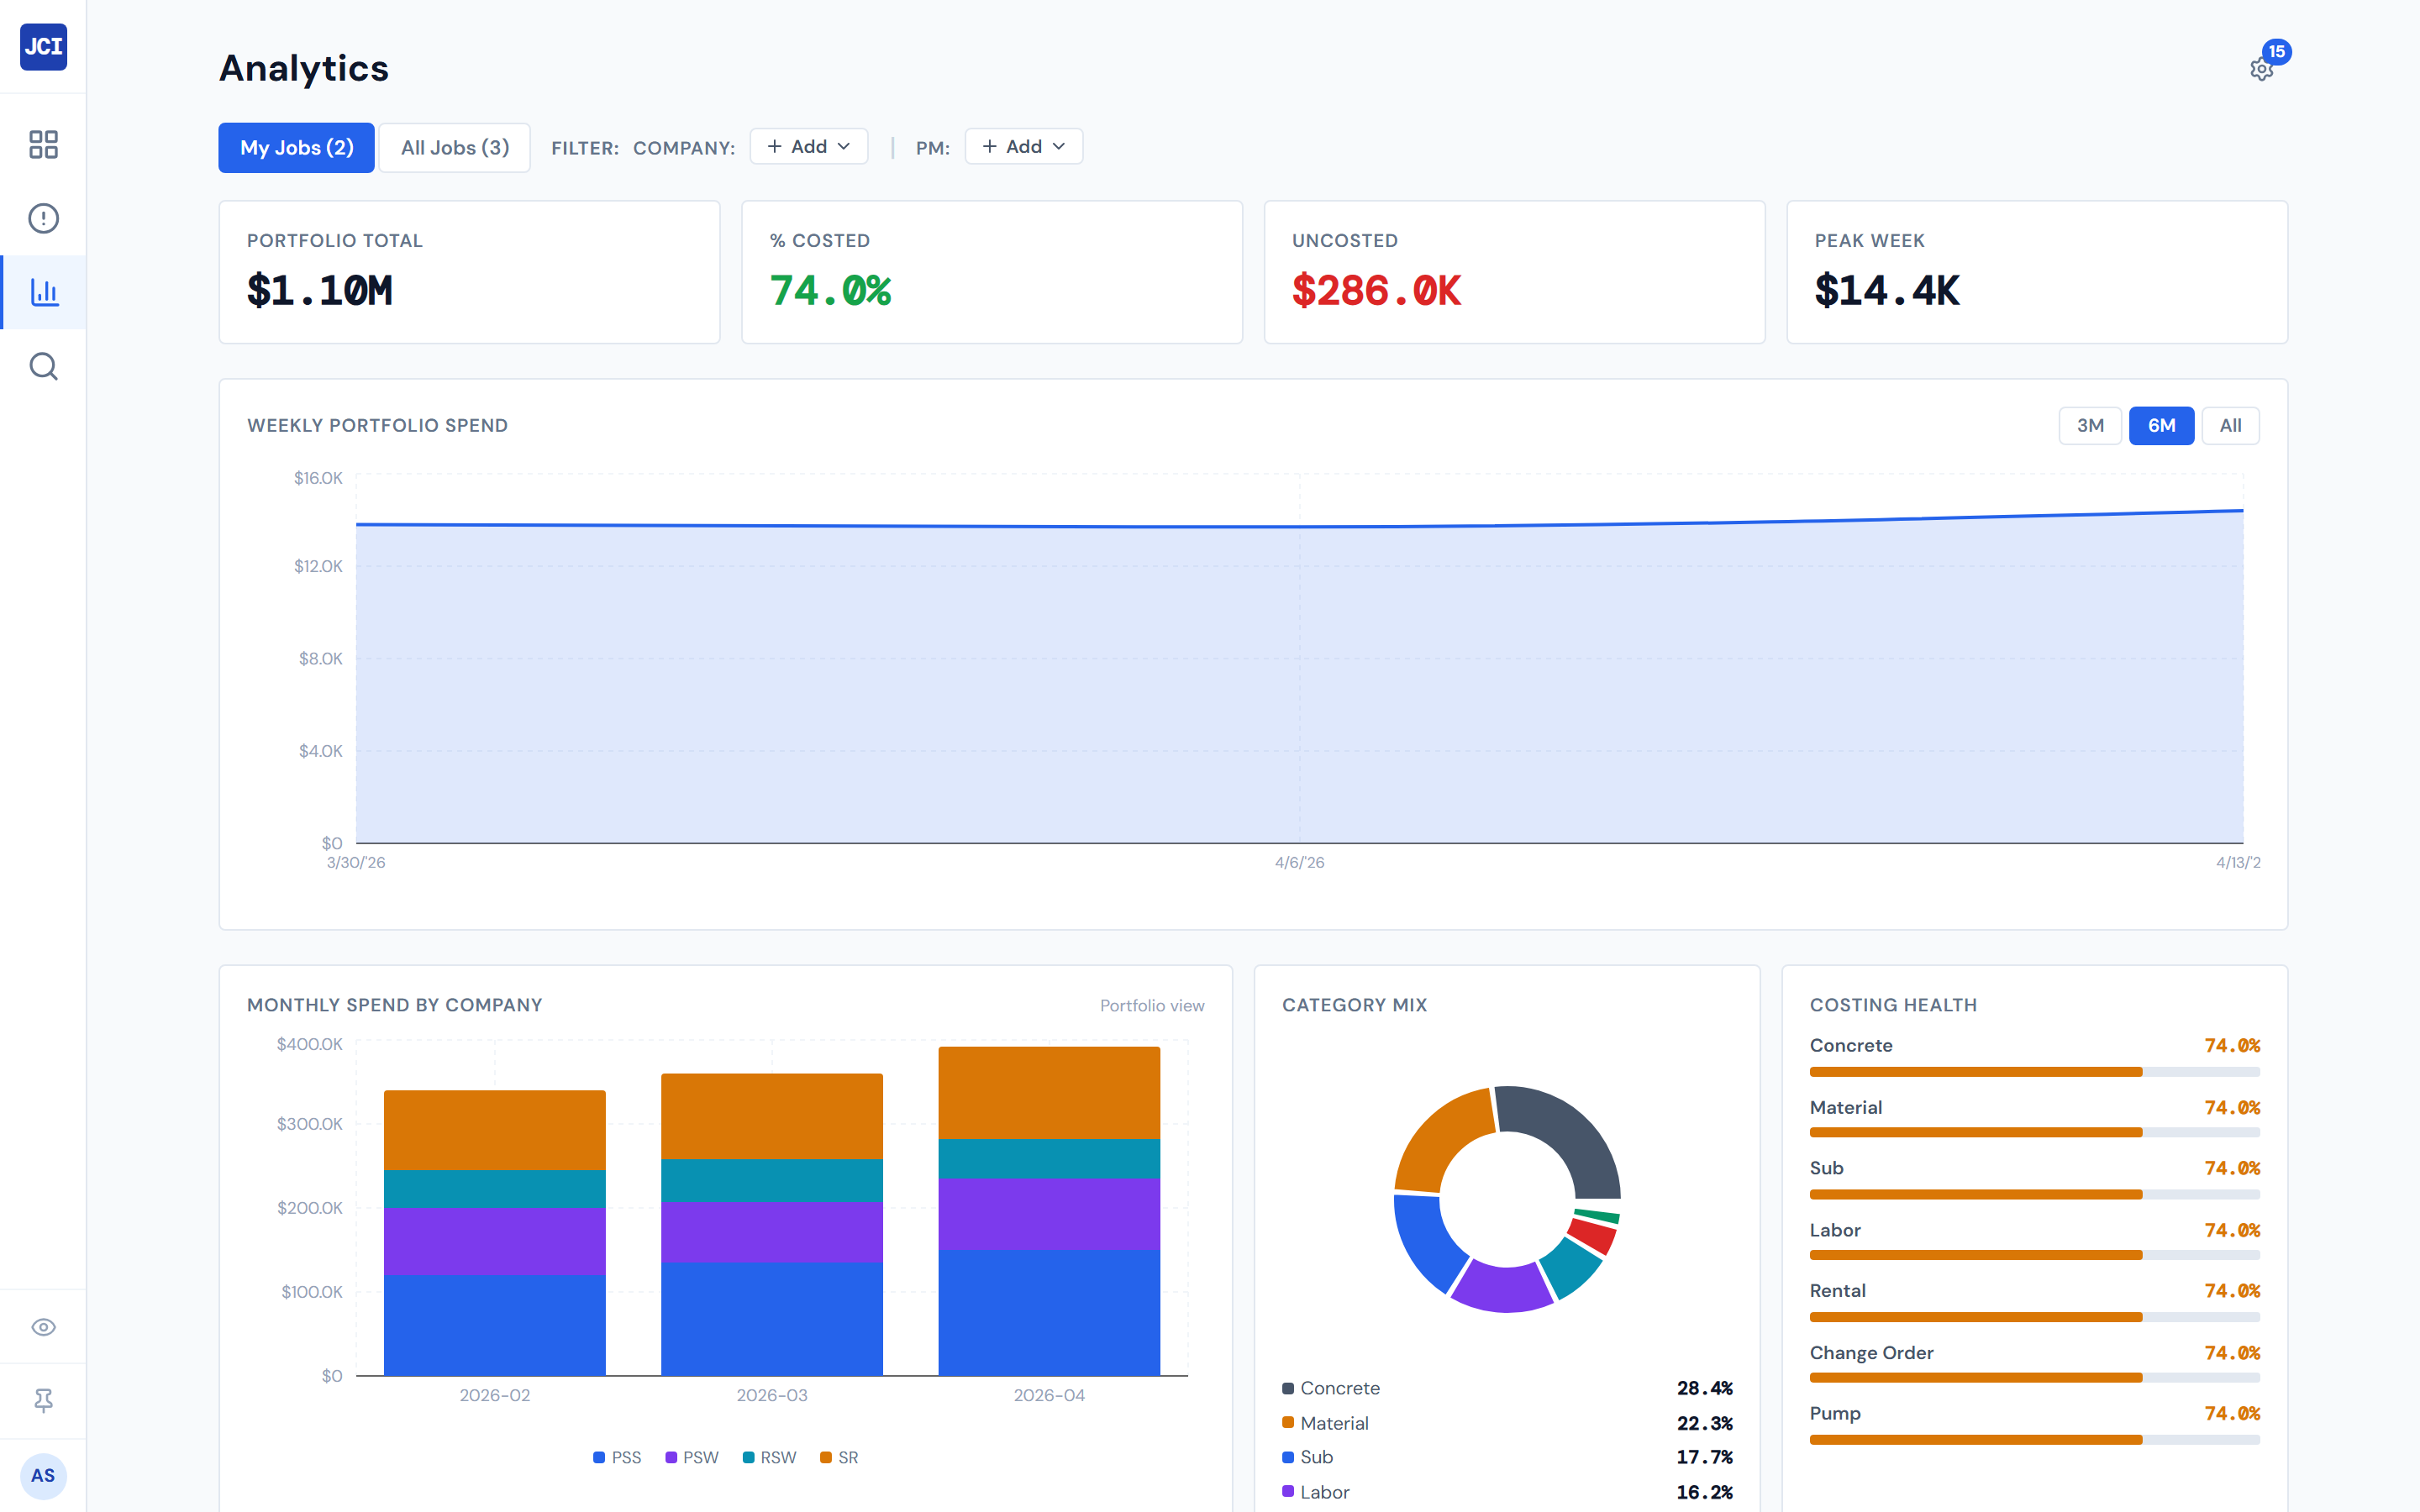
Portfolio Widgets
Five widgets that compare jobs to each other, companies to each other, project managers to each other, or cost codes within a single job. These are snapshot views of the current portfolio state — not trend views.
For the time-series counterpart ("how is spend changing over time?"), see Spend widgets.
Snapshot views, not trend views. For the over-time view of the same money, head to the spend catalog.
At a glance
| Widget | Best for | Page(s) | Scope |
|---|---|---|---|
| Job Health Gauge | "How much of contract have we spent?" | Job Detail | One job |
| Cost Code Treemap | "Which cost codes are biggest on this job?" | Job Detail | One job |
| Portfolio Bee Swarm | "How are jobs distributed by company and size?" | All Jobs, Analytics | Portfolio |
| Company Radar | "How do these 2–4 companies compare?" | All Jobs, Analytics | Cross-company |
| PM Leaderboard | "Whose POs are sitting un-confirmed?" | All Jobs, Analytics | Cross-PM |
Job Health Gauge
One-line purpose — One-glance share of contract value spent on this job.
Where you'll see it — Job Detail.
What it shows — A half-doughnut gauge from 0 to 100% with three color zones — green under 70% (On Track), amber 70–90% (Caution), red 90% and above (Critical). The percentage shows big in the gauge color.
Tier 2 controls — None.
Drill — None.
Empty state — "No contract value set — enter it on the Budget Entry tab to see health."
Same widget appears in the budget & billing catalog. The thresholds (70 and 90) are the same wherever you mount it.
Cost Code Treemap
One-line purpose — Show every meaningful cost code on this job as a rectangle sized by spend.
Where you'll see it — Job Detail.
What it shows — Up to 20 cost-code rectangles, sized by total spend, plus an "Other (N)" rectangle aggregating everything past the top 20. The tooltip shows the cost-code description, total spend, and percent of job total. Colors are decorative (cycle through the pie palette), not categorical.
Tier 2 controls — A category dropdown.
Drill — Click a rectangle to emit a cost-code filter chip; the PO Detail table on the same job narrows to that cost code. The "Other (N)" rectangle has no single cost code, so its click is a silent no-op.
Portfolio Bee Swarm
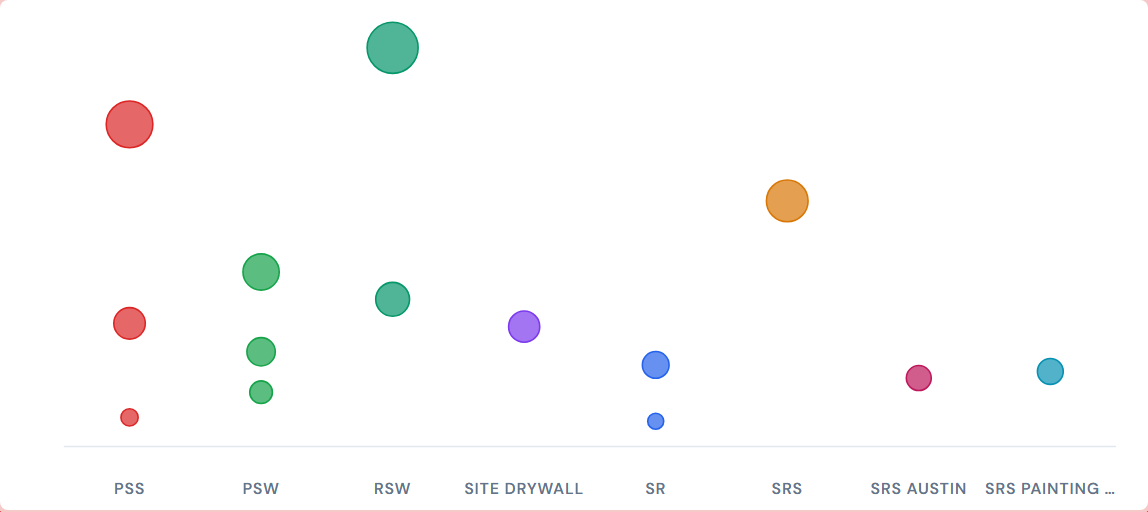
One-line purpose — Show every job as a dot, clustered by company, with dot size scaled by spend.
Where you'll see it — All Jobs, Analytics.
What it shows — Up to 80 jobs, sorted by total cost descending. Each dot's color comes from a company palette covering all 8 companies. Dot radius scales as the square root of cost so a $1M job is roughly 3× the radius of a $100K job, not 10×. Dots cluster horizontally by company column with a force layout that prevents overlap.
Tier 2 controls — None.
Drill — Hover a dot for the job name and total.
Caps at the top 80 jobs by spend. Smaller jobs in your portfolio may not appear on the chart. Dot size is square-root scaled so massive jobs don't drown out the visual — a reader who interprets dot area as proportional to cost will be roughly right; a reader interpreting radius will be off.
If a job appears as a slate (default-colored) dot rather than a company color, that's a sister company that hasn't been added to the color palette yet — worth a ticket if it's persistent.
Company Radar
One-line purpose — Side-by-side multi-metric comparison of 2–4 selected companies.
Where you'll see it — All Jobs, Analytics.
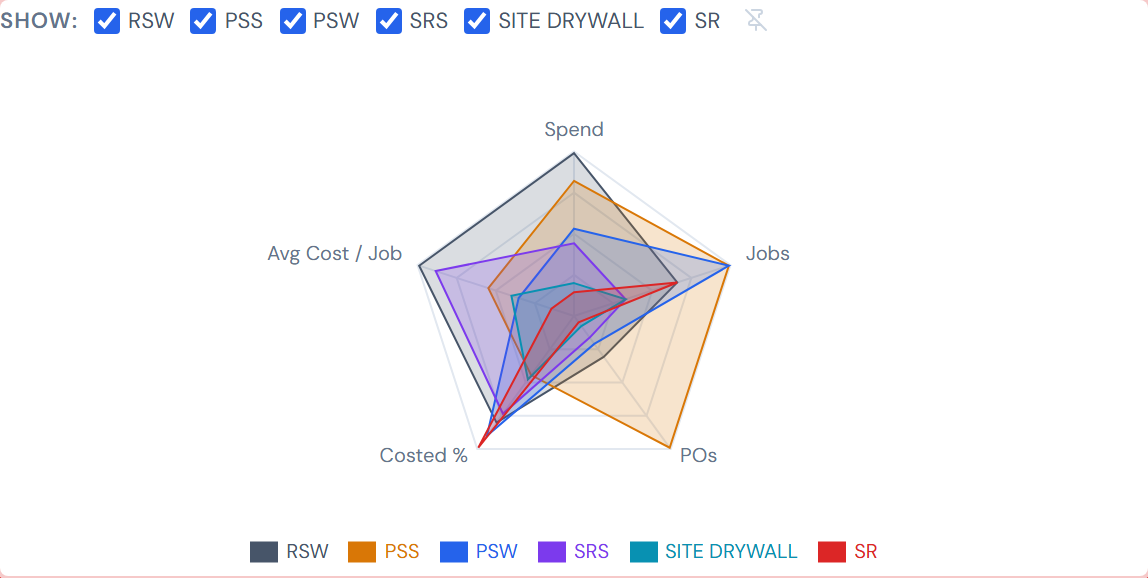
What it shows — A radar (spider) chart with 5 axes: Spend, Jobs, POs, Costed %, Avg Cost / Job. Each company gets one filled polygon. The shape is what to read — bigger or wider polygon = larger absolute presence on those metrics relative to the selected set.
Tier 2 controls — A company-checkbox group (pinnable) that lets you pick which 2–4 companies to compare.
Drill — Hover an axis tip for per-metric values across all selected companies. The tooltip shows the actuals, not the normalized values plotted on the chart.
Polygon sizes are relative to the selected companies. Adding or removing a company can reshape the other polygons — because each metric is divided by the maximum value across whichever companies are currently checked. Use the chart for shape comparison and the tooltip for absolute numbers.
PM Leaderboard
One-line purpose — Highlight which PMs have the most un-confirmed PO work.
Where you'll see it — All Jobs, Analytics.
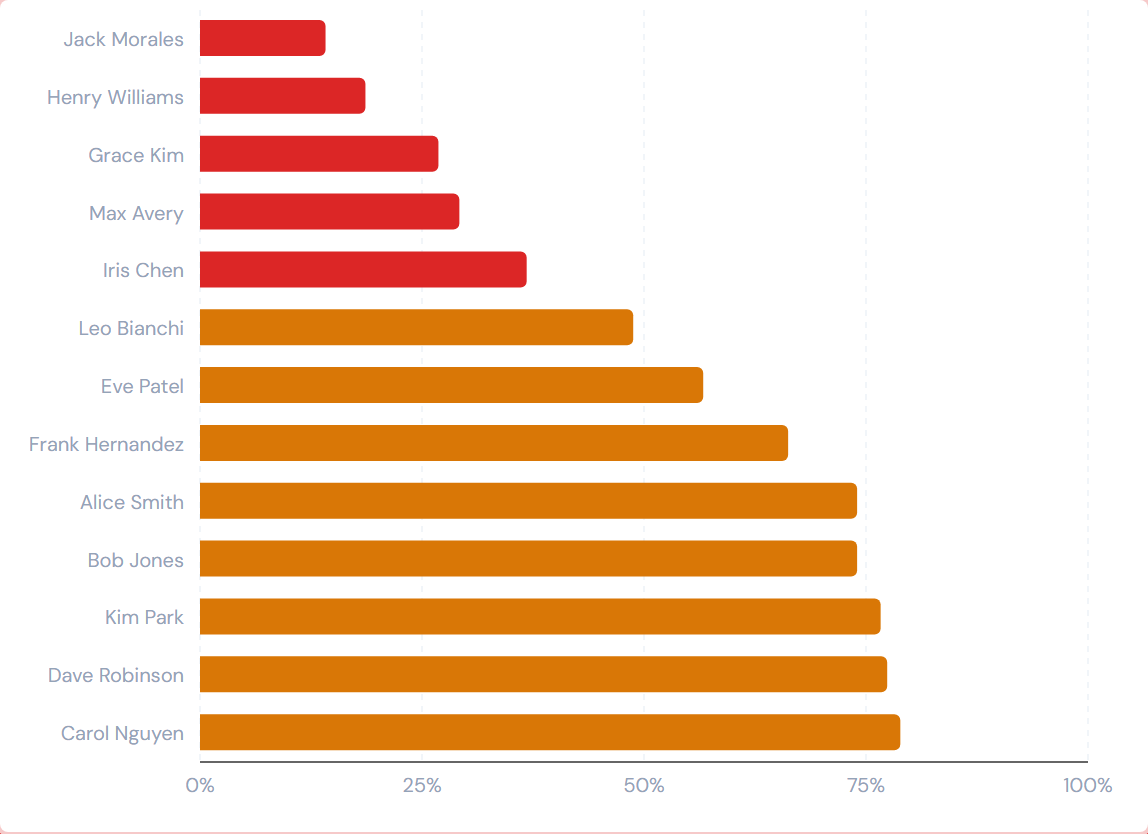
What it shows — A horizontal bar chart, one bar per PM, ranked by costed % ascending — the PM with the lowest confirmation rate appears at the top. Bars are colored by threshold: red below 40%, amber 40–80%, green at or above 80%. Each bar is labeled with the PM's display name; the tooltip shows job count and the costed % value.
Tier 2 controls — None.
Drill — Click a bar to filter the page to that PM's jobs.
Ranked by costed % ascending — the PM at the top has the most un-confirmed POs, not the most spend. Use this widget to spot workload bottlenecks ("who needs help getting their queue clear?"), not to rank performance. A PM with a low costed % may simply have the most volume.
Bars labeled "Unassigned" or with unfamiliar strings reflect known data-quality variations in how the PM field was historically entered. See My Jobs vs All Jobs for context on the PM field.
Hiding and showing widgets
Use the gear icon on the page to toggle which portfolio widgets appear. See the widgets overview for the mechanic.
Related reading
- Spend widgets — the time-series counterpart to these snapshots
- Budget & billing widgets — for Gross Margin and dollar-vs-budget views; Job Health Gauge is also documented there
- Vendor widgets — for the PO-pipeline view that complements the rate-based PM Leaderboard
- Companies and access — for the 8-company list referenced by Bee Swarm and Company Radar
- My Jobs vs All Jobs — for the PM-field context that affects PM Leaderboard
- Data refresh rates — numbers can be up to 4 hours stale
- PO lifecycle colors — for the costed-vs-pending vocabulary that drives PM Leaderboard's color zones
- The filter banner — page filters affect the cross-cutting widgets
- My Jobs toggle — most readers pair My Jobs with these widgets to scope to their book