Spend & Trend Widgets
Six widgets that all answer some flavor of where is the money going, and how fast? Some live on the Job Detail page (single-job view) and the rest live on All Jobs and Analytics (portfolio view).
Need a one-job view? Use Cost Waterfall or Spend Pace. Need a portfolio view? The other four are for you.
At a glance
| Widget | Scope | Best for | Page(s) |
|---|---|---|---|
| Cost Waterfall | One job | "Where did this job's money go?" | Job Detail |
| Spend Pace | One job | "Are we on pace?" | Job Detail |
| Sparklines | Top jobs | "Which jobs are accelerating?" | All Jobs |
| Spend Trend Multiples | Top companies | "Which company is diverging?" | All Jobs, Analytics |
| Month-over-Month Slope | Whole portfolio | "Is the book trending up?" | All Jobs, Analytics |
| Category Heatmap | Top jobs by category | "Where is spend concentrated?" | All Jobs, Analytics |
Cost Waterfall
One-line purpose — Category-by-category cost breakdown for a single job.
Where you'll see it — Job Detail.
What it shows — One bar per PO category (Concrete, Material, Sub, Rental, Pump, Labor, Change Order). Bar height is the total resolved cost in that category, sorted descending. Each bar uses that category's chart color so the visual matches the rest of the dashboard.
Tier 2 controls — A Hide Pump checkbox (pinnable). Pump is always $0 in the data, so hiding it tightens the chart.
Drill — Click any bar. A category filter chip appears in the page filter bar, and the PO Detail table on the same page narrows to that category.
The Pump bar will read $0. That's the data, not a bug — see Categories for why.
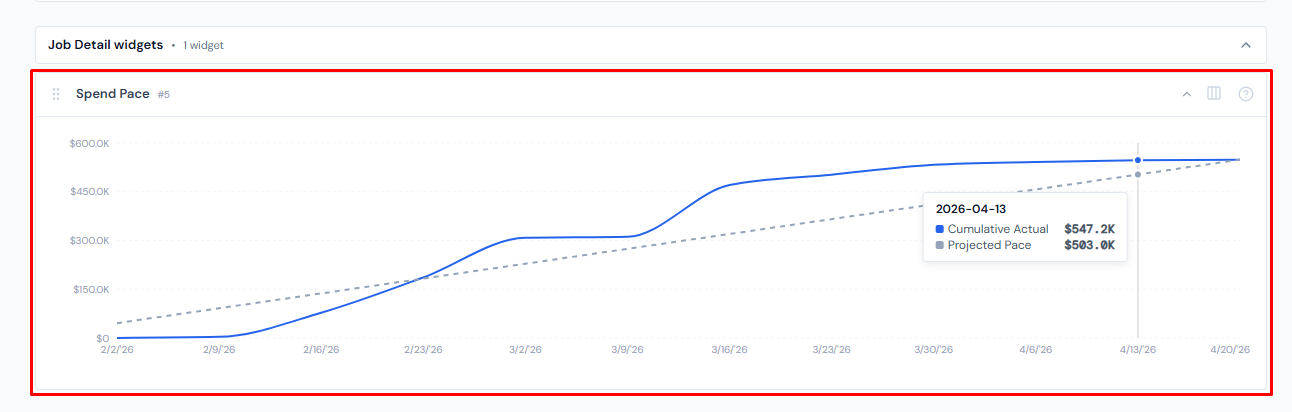
Spend Pace
One-line purpose — Cumulative spend on this job, actual against an even-pace baseline.
Where you'll see it — Job Detail.
What it shows — Two lines plotted over weeks. Actual is solid brand blue, cumulative spend through that week. Projected is a dashed grey baseline calculated as total spend ÷ number of weeks × week index — the line you'd be on if spending were perfectly even from start to finish. If Actual sits above Projected, the job is over pace; below, it's under pace.
Tier 2 controls — None.
Drill — None. Read-only chart.
The Projected line is a naive even-pace baseline, not a budget-derived forecast or an S-curve. A job that ramps slowly then spikes will look "over pace" near the end even when total spend lands on budget. Use it as a first-look pacing check, not a forecasting tool.
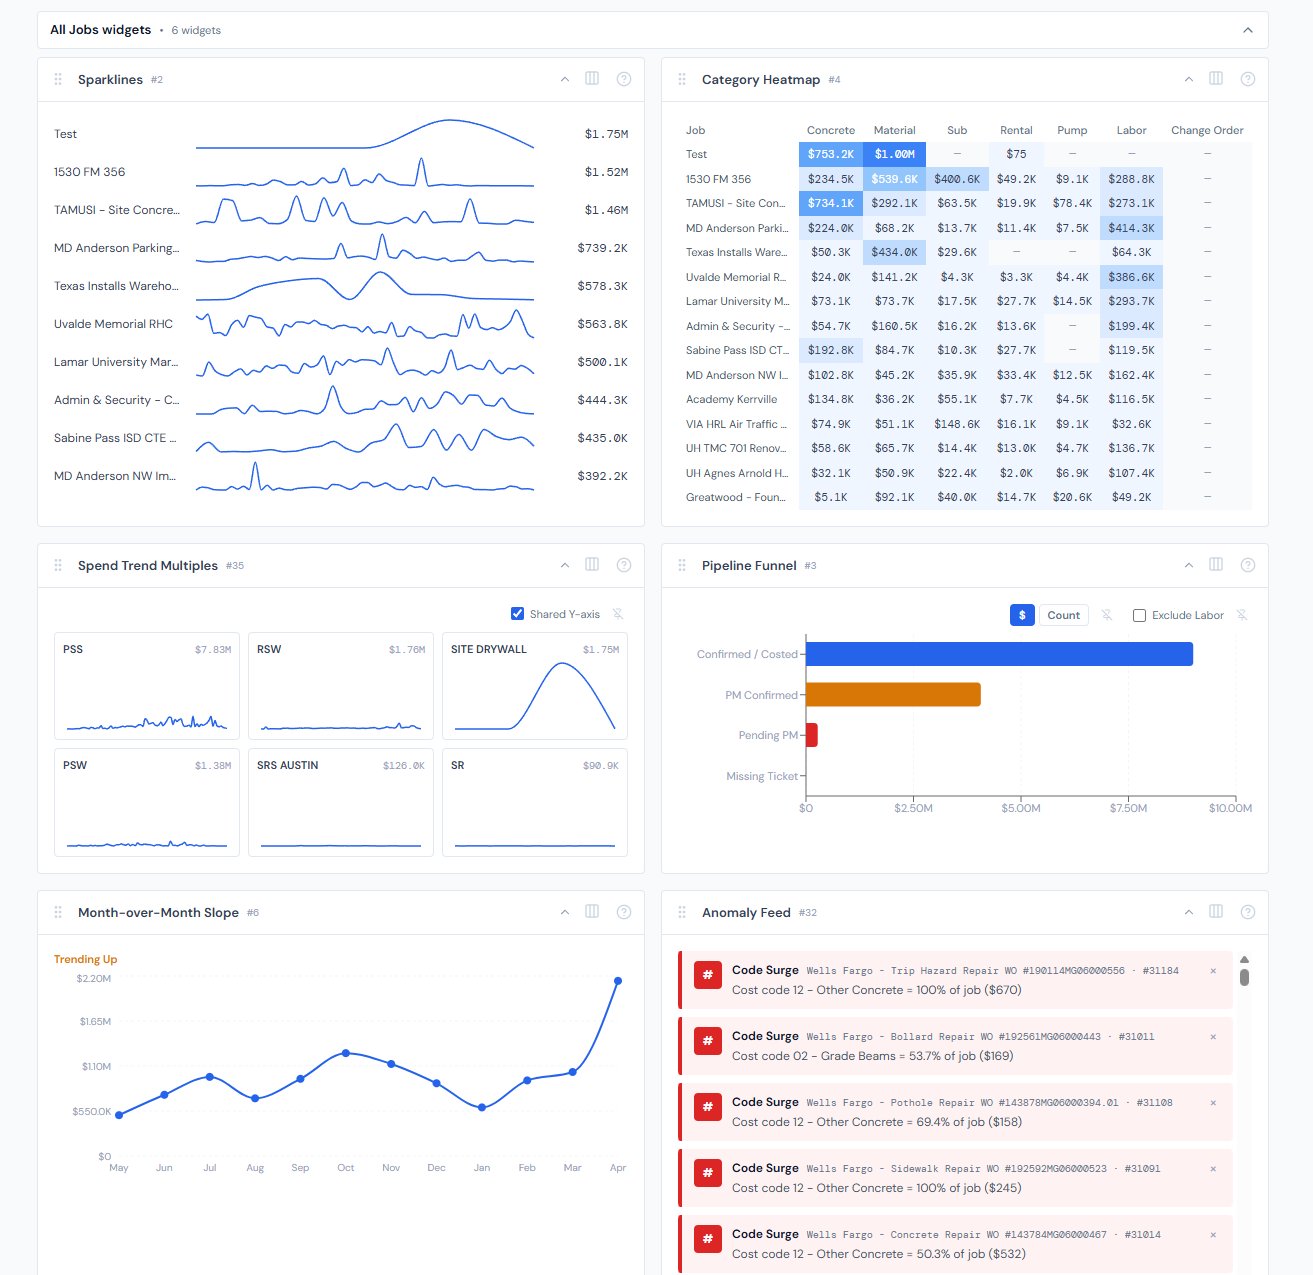
Sparklines
One-line purpose — A tiny weekly trend line for each top job, designed to scan.
Where you'll see it — All Jobs.
What it shows — Up to 10 rows, one per top job by spend. Each row carries the job name, a 32-pixel-tall sparkline of weekly spend, and the job's running total. Hover any sparkline for the latest week's value.
Tier 2 controls — None.
Drill — Hover only.
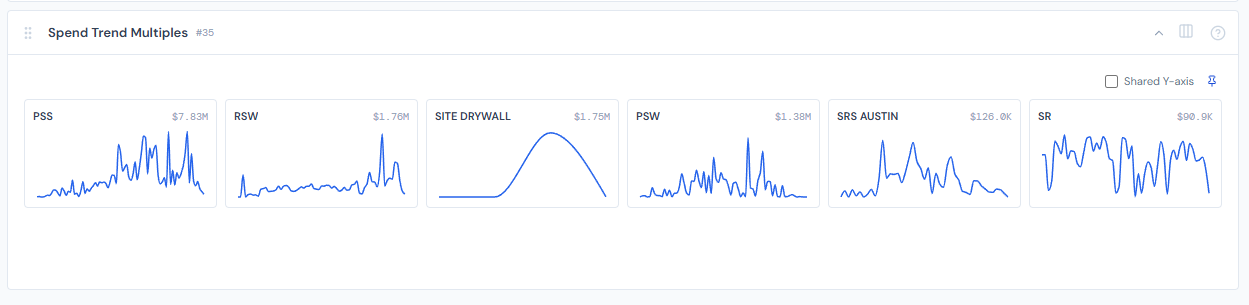
Spend Trend Multiples
One-line purpose — Side-by-side mini line charts comparing weekly spend across companies.
Where you'll see it — All Jobs, Analytics.
What it shows — Up to 6 mini line charts, one per top company by spend, in a responsive grid of 180-pixel cards. Each card carries the company name, total dollars, and a weekly spend line.
Tier 2 controls — A Shared Y-axis checkbox (pinnable). When on, every mini uses the same Y-domain so magnitudes are directly comparable. When off, each card auto-scales to its own range so the shapes are comparable instead.
Drill — Hover only.
Month-over-Month Slope
One-line purpose — A single line showing the whole-portfolio spend trend by month.
Where you'll see it — All Jobs, Analytics.
What it shows — One point per month for the last 12 months, calculated by rolling weekly spend rows into months. Above the chart, a colored label reads either "Trending Up" (last month was at least the prior month) or "Trending Down" (last month was lower).
Tier 2 controls — None.
Drill — None.
"Trending Up" is amber, not green. Up costs more, so the widget treats an upward portfolio trend as a soft warning rather than a positive signal. Readers used to up-arrow-good chart conventions may misread it at first glance.
Category Heatmap
One-line purpose — Spend intensity by job and PO category, in a single colored grid.
Where you'll see it — All Jobs, Analytics.
What it shows — Rows are the top 15 jobs by total spend. Columns are the 7 PO categories (Concrete, Material, Sub, Rental, Pump, Labor, Change Order). Cell color is a 6-step blue intensity scale relative to the maximum cell across the whole grid. Cells with $0 render as a — on a slate background.
Tier 2 controls — None.
Drill — Hover for a per-cell tooltip; no click navigation.
This is a jobs × categories grid. Rows are your top jobs by spend, not your companies. If you're looking for a per-company breakdown, see Spend Trend Multiples instead.
When a widget unexpectedly shows empty
Three widgets here — Sparklines, Spend Trend Multiples, and Month-over-Month Slope — read every individual row of weekly spend data and aggregate inside your browser. If any of them goes empty on a page that should have data, the most likely cause is an upstream data shape change, not a refresh issue. File a ticket rather than a refresh-and-pray — the fix lives upstream of the widget itself.
This is rare, but worth knowing about so you don't spend time toggling filters trying to coax data out. The same does not apply to Cost Waterfall, Spend Pace, or Category Heatmap — those have their own independent paths.
Top-N caps
Each widget on this page caps how much it shows. Filtering the page narrower doesn't lift the cap — it changes which top-N rows are picked from the filtered slice.
| Widget | Cap |
|---|---|
| Sparklines | Top 10 jobs |
| Spend Trend Multiples | Top 6 companies |
| Category Heatmap | Top 15 jobs |
| Cost Waterfall | All 7 PO categories (no cap) |
| Spend Pace | Single job (no cap) |
| Month-over-Month Slope | Last 12 months (no cap) |
If a job or company you expected to see isn't on the chart, the page filters and the top-N cap together are doing the trimming.
Page filters cascade in
Every widget on this page reads from the same filtered slice as the rest of the page. When you change My Jobs, the company filter, the PM filter, or the date range in the page's filter bar, each widget recomputes against that slice. See the filter banner for how filters chain together, and the My Jobs toggle for the most common starting point.
Hiding and showing widgets
Widgets aren't fixed in place. Use the gear icon on the page (the Widget Settings panel) to toggle which spend widgets appear. See the widgets overview for the full mechanic.
Related reading
- Categories — the 7 PO categories used by Cost Waterfall and Category Heatmap
- Data refresh rates — numbers can be up to 4 hours stale
- Budget & billing widgets — for the dollars-vs-budget angle
- Portfolio widgets — for cross-job and cross-company spread views that aren't time-series
- Troubleshooting — for the "widget shows empty when it shouldn't" path