Category Cards Tab
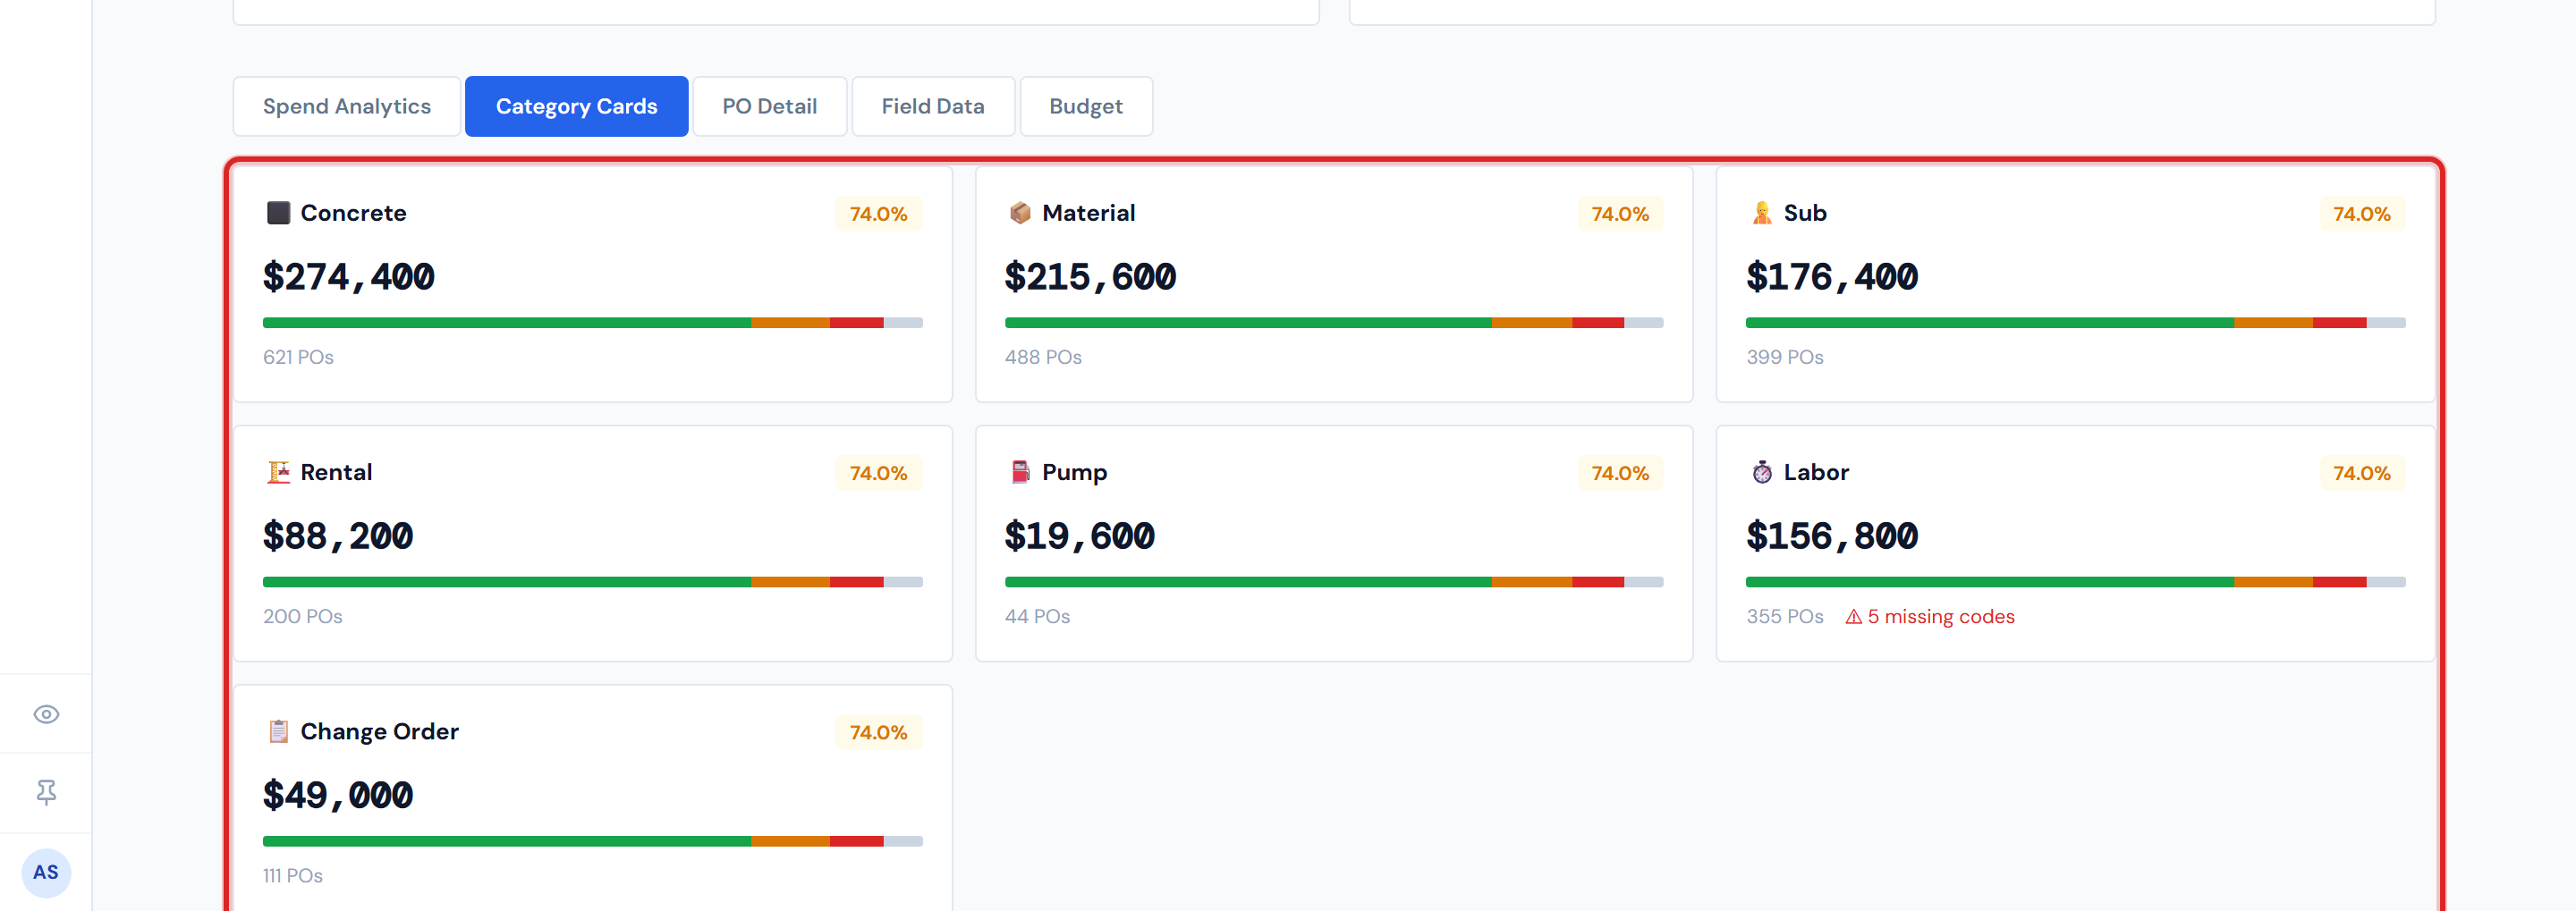
Category Cards is a grid view of spend by category on a single job. Each tile shows one category — name and icon, percent costed, total dollars, the four-bucket confirmation status bar, PO count, and (if applicable) a missing-codes flag. Click any card to drop into the PO Detail tab with that category pre-filtered.
It's the same data as Spend Analytics, just shaped differently. Use Category Cards when you want to see "where is the spend on this job, and how much of it is locked in" at a glance.
The seven possible categories
Categories on this tab match the Categories reference. In screen order:
| Icon | Category |
|---|---|
| 🪨 | Concrete |
| 🧱 | Material |
| 🛠️ | Sub |
| 🚜 | Rental |
| 🔧 | Pump |
| 👷 | Labor |
| 📋 | Change Order |
Only categories with activity on this specific job render a card. A job with no rentals won't have a Rental card. So expect somewhere between one and seven cards depending on what kind of job it is.
Anatomy of a single card
Top to bottom:
- Top row — the category icon and name on the left; a small percent-costed pill on the right. The pill color follows the same threshold rule as the page-level % Costed scorecard:
- Green at 80% or higher
- Amber from 40% through 79%
- Red below 40%
- Big number — the total dollar amount for this category on this job.
- Four-segment status bar — same four buckets as the Confirmation Pipeline up top (Costed, PM Confirmed, Pending PM, Missing), but scoped to just this category's POs.
- Footer — PO count on the left ("4 POs"). On the right, if any labor lines in this category are missing a cost code, a red flag reading ⚠ N missing codes. Otherwise no flag.
Click to drill
Click anywhere on a card and the page switches to the PO Detail tab with that category set as a filter chip. It's the same drill-through as clicking a slice on the Spend Analytics pie.
When you switch back from PO Detail to Category Cards, the card you came from stays bordered with a "selected" highlight — so you can see at a glance where you just were.
A few caveats
The status bar inside each card is the same four buckets, not five colors
The status bar inside each card uses the same four buckets as the page-level Confirmation Pipeline (Costed, PM Confirmed, Pending PM, Missing). It's not the same as the five PO lifecycle colors you'll see on PO Detail. The bar collapses Confirmed (Blue) and Accounting Costed (Green) into the single Costed bucket. See PO Lifecycle Colors for the full five-color picture.
Pump cards can show $0
If the job has any Pump rows in source data, a Pump card will appear — even if its total reads $0. Pump dollars are never populated; that's normal. See Pump in the Glossary.
A "Change Order" card is just a category roll-up
Clicking the Change Order card lands you on PO Detail filtered to Change Order. If you want the full impact story — original total, adjusted total, the high-impact alert — read Change Orders.
Missing codes flag = labor lines without a cost code
The red "⚠ N missing codes" footer flag counts labor lines that have no cost code. That's distinct from the gray Missing Ticket PO status (which means a PO has no uploaded ticket image). Don't conflate the two — see PO Lifecycle Colors. The fix path for missing codes is Missing Cost Codes in the Action Queue.
Numbers can be a few hours stale
Same 4-hour refresh that applies everywhere else on Job Detail. See Data Refresh Rates.
Related reading
- Job Detail Overview — the page-level tour
- Spend Analytics Tab — the same data in chart form
- PO Detail Tab — where a card click takes you
- Change Orders — the deeper Change Order story
- Categories — the canonical category list
- PO Lifecycle Colors — the five-color legend (vs. the four-bucket status bar)
- Missing Cost Codes (Action Queue) — fixing the missing-codes flag
- Pump in the Glossary — for the always-$0 caveat
- Data Refresh Rates — why numbers can be a few hours behind