Header and Scorecards
The top of every Job Detail page tells you everything you can learn about a job in five seconds without picking a tab: who it is, how big it is, how much of it is locked in, and where the work is sitting in the pipeline. This page walks each piece — the header strip, the four scorecards, and the Confirmation Pipeline card — and explains when each number is something to act on.
The header strip
A single row directly under the action bar.
- Job number chip — monospace, brand-blue background. The shortest unique identifier for the job. The same number is in the URL.
- Job name — the full project name, in bold.
- Company and PM — small light-gray text. The company is one of the operating companies; the PM is whoever is mapped to this job in the PM directory.
- Settings gear (right side) — opens the widget panel for whichever main tab is active. The badge count and panel contents change as you switch tabs. See the Widgets chapter.

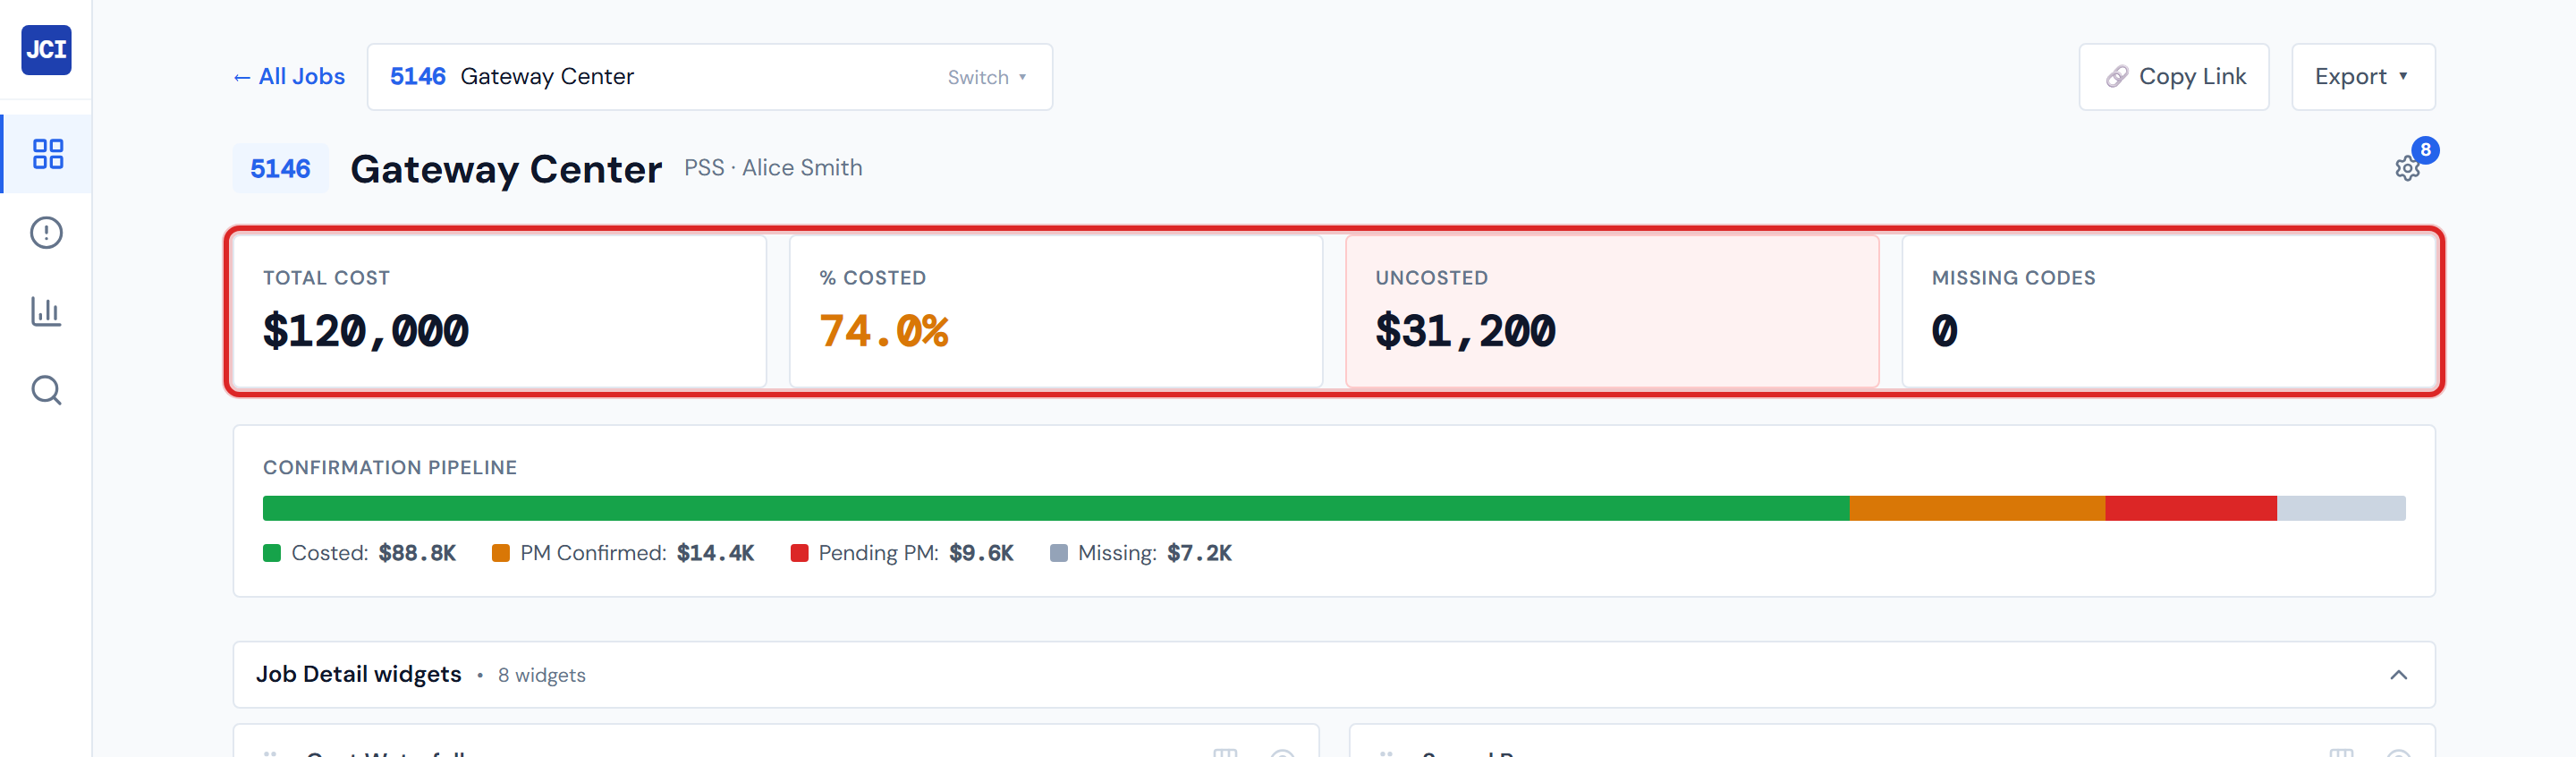
The four scorecards
A row of four tiles below the header.
Total Cost
The sum of all PO costs on this job. The dashboard uses a cost waterfall — it takes the accounting-costed amount when one is on file, otherwise the confirmed cost, otherwise zero. No alert color; this number is informational.
Total Cost is the sum of resolved PO costs the job has accumulated so far. It's not the same as the customer-facing contract value. Contract value is captured separately on the Budget tab.
% Costed
What fraction of Total Cost has been finalized by accounting. The number itself is colored by threshold:
| Value | Color | Reading |
|---|---|---|
| 80% or higher | Green | Most spend is locked in. |
| 40% – 79% | Amber | Significant spend is still in flight with accounting. |
| Below 40% | Red | Most spend is unprocessed. |
Get them right — green at 80 or above, amber from 40 through 79, red below 40. This is the same threshold the Category Card percent-costed badges use.
Uncosted
Total Cost minus Costed Cost, in dollars. Outlined red whenever the value is greater than zero, because any uncosted spend is something accounting still has to process.
A clean job (zero uncosted) shows the value with no red border. Uncosted is not "always red" — it's red because there's work still to do.
Missing Codes
The count of labor lines on this job that have no cost code. Outlined red whenever the count is greater than zero. This is a count, not a dollar amount — the scorecard reads "3," not "$3,000."
If this scorecard is red, the fix lives on Missing Cost Codes in the Action Queue, not here. The dashboard surfaces the count; the action happens there.
If Uncosted is red, accounting still has work to do. If Missing Codes is red, you do — head over to the Action Queue. If both are clean, the job is in good shape.
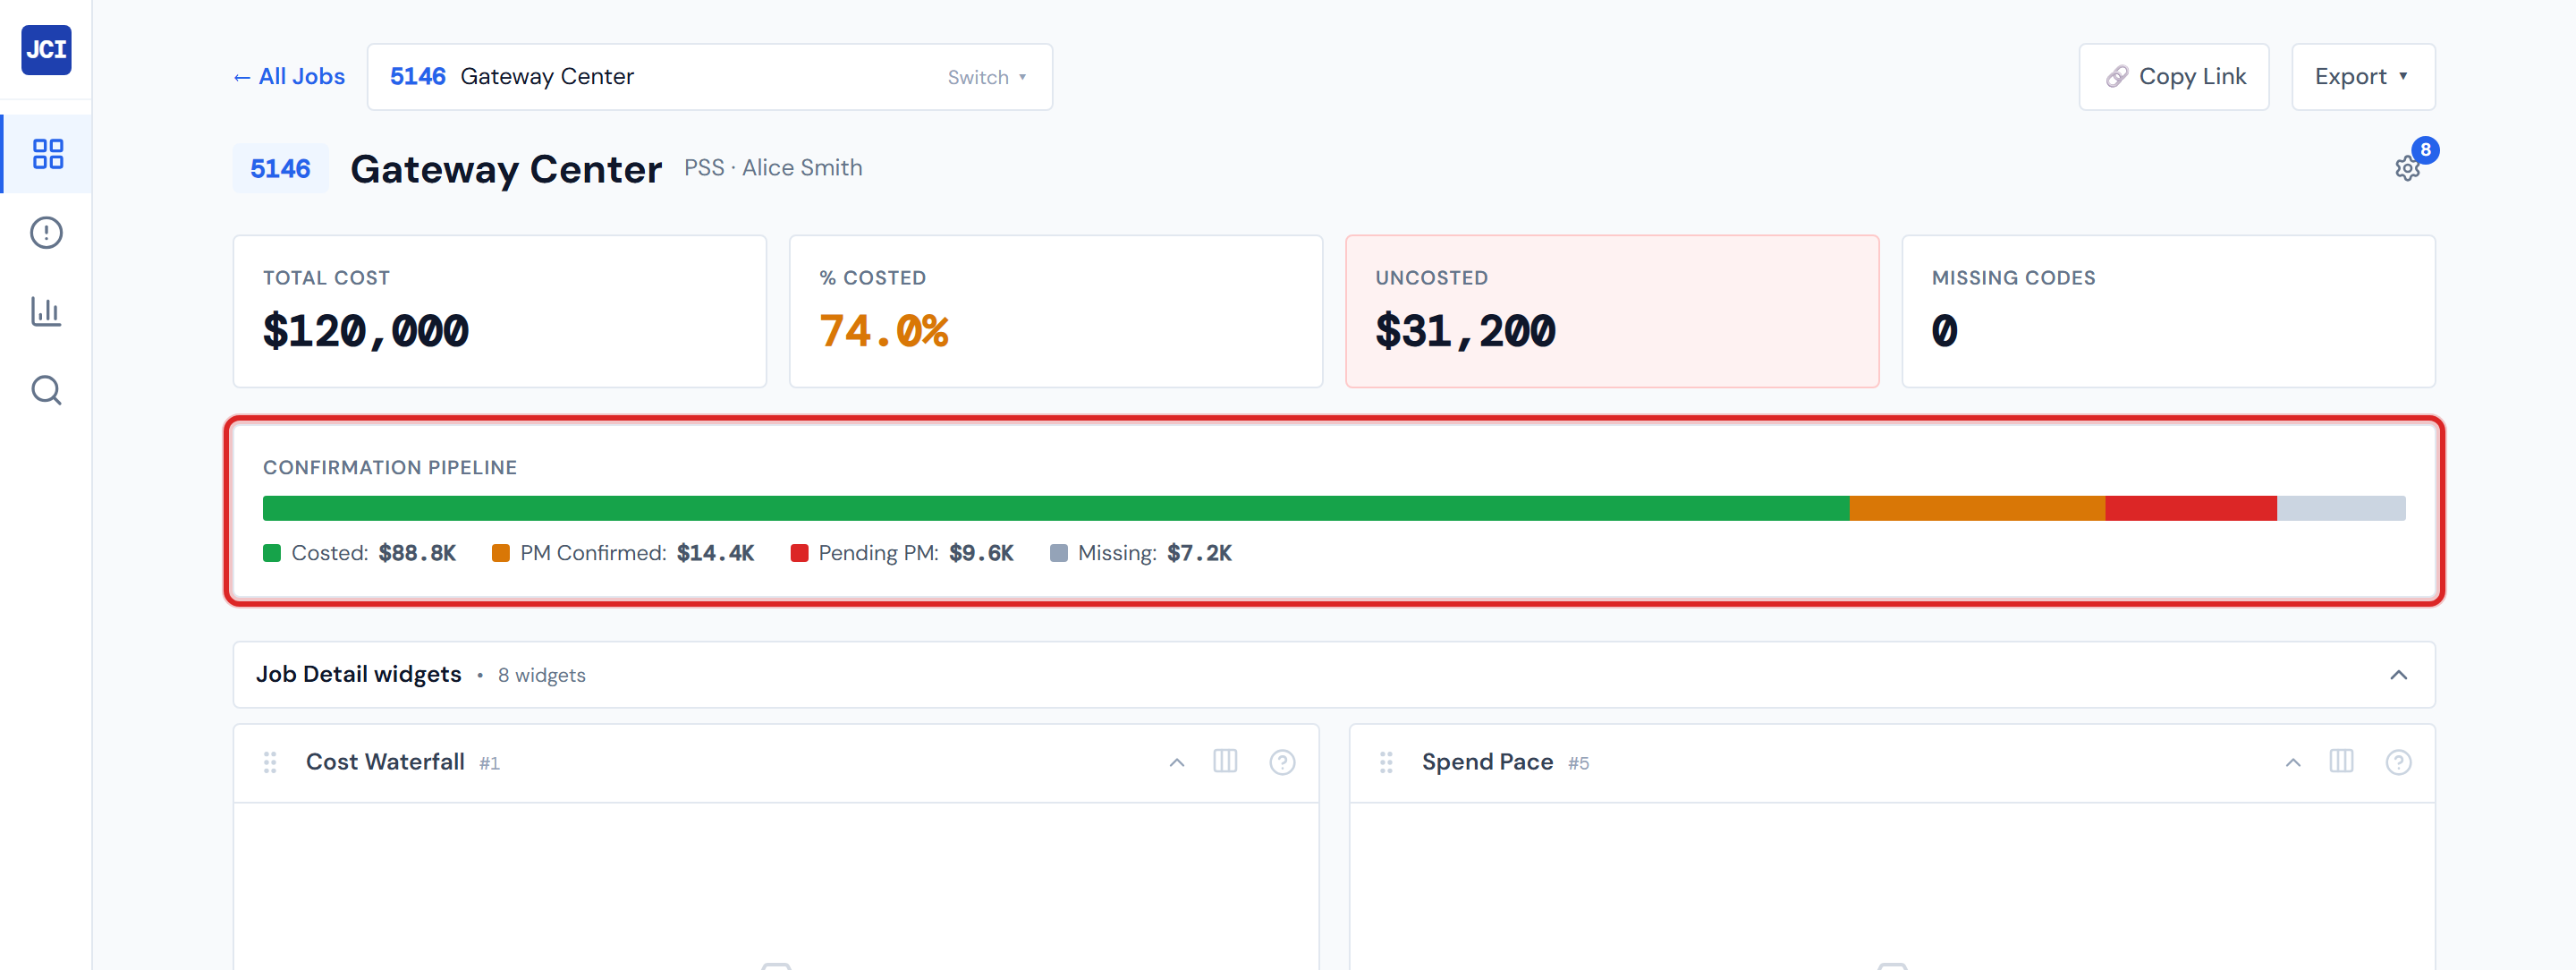
The Confirmation Pipeline card
A single horizontal status bar beneath the scorecards. Always rendered.
The bar splits the job's Total Cost across four buckets, each segment sized in proportion to the dollars in that bucket. Below the bar, the same four legend items appear with their dollar totals.
| Color | Bucket | What it means | Whose turn |
|---|---|---|---|
| Green | Costed | Locked in — labor auto-confirmed, or accounting has costed it. | Done |
| Amber | PM Confirmed | You confirmed the PO. Now waiting on accounting to code it. | Accounting |
| Red | Pending PM | A ticket has been uploaded; waiting on you to confirm the PO. | You |
| Gray | Missing | No ticket image has been uploaded for the PO yet. | The field team |
The green Costed segment will dominate most pipelines — that's because most rows in the system are auto-confirmed labor lines. Don't read a big green bar as "we're done." Pair it with a glance at the red and gray totals.
Why four buckets here, five colors on PO Detail
This is the most important non-obvious point on this page.
The Pipeline card collapses Confirmed (Blue) and Accounting Costed (Green) into the single Costed bucket because both mean "no further PM action." The PO Detail tab keeps them as separate colors because there it's useful to tell auto-confirmed labor lines apart from accounting-coded material POs. Same data, different rollup. See PO Lifecycle Colors for the authoritative five-color legend.
So when a reader's eye bounces between the green Costed bar up here and a sea of blue Confirmed badges down on PO Detail, the colors don't disagree — they're showing different views of the same rows.
A few caveats
The PM in the header is whatever the directory has on file
The PM field on a job comes from the PM directory. That directory has, historically, been a mix of user IDs, plain names, comma-separated lists, and the occasional typo. If the PM here looks wrong, that's a directory issue, not a dashboard problem. See My Jobs vs. All Jobs for the deeper explanation and what to do about it.
Pump dollars are always $0
You won't see this on the scorecards directly, but if you compare these numbers to a category breakdown later, anything in the Pump category will read $0. That's not a missing value — Pump dollars are simply never populated in source data. See Pump in the Glossary.
Numbers can be a few hours stale
Total Cost, % Costed, and the Confirmation Pipeline percentages all come from materialized tables that refresh every four hours. So a labor line clocked in 30 minutes ago won't show up here yet. See Data Refresh Rates.
Related reading
- Job Detail Overview — the page-level tour
- PO Detail Tab — where the five PO colors live in the wild
- PO Lifecycle Colors — the authoritative color legend
- Missing Cost Codes (Action Queue) — where to fix a nonzero Missing Codes scorecard
- My Jobs vs. All Jobs — for the messy PM-field caveat
- Data Refresh Rates — why the page can be a few hours behind
- Glossary — Total Cost, % Costed, Uncosted, Missing Codes, Costed, PM Confirmed, Pending PM, Missing, Pump