Field & Labor Widgets
Nine widgets that show what's actually happening on a jobsite — labor hours, crew size and composition, equipment on site, daily report submissions, subcontractor activity, and weather. The cost-and-billing side of a job lives elsewhere; this is the field-data side.
The nine fall into four loose clusters: labor effort (Labor Cost Code Bars, Labor Hours vs Cost Scatter, Crew Timeline, Overtime KPIs, Worker Heatmap), equipment (Equipment Matrix), field activity (Daily Report Calendar, Sub Timeline), and weather (Weather Impact).
Most field widgets live on Job Detail › Field Data. The portfolio outliers — Labor Hours vs Cost Scatter, plus the partially-portfolio Equipment Matrix and Daily Report Calendar — live on All Jobs and Analytics.
At a glance
| Widget | Best for | Page(s) | Cluster |
|---|---|---|---|
| Labor Cost Code Bars | "Where are labor hours going on this job?" | Job Detail | Labor |
| Labor Hours vs Cost Scatter | "Which jobs are paying more per hour?" | All Jobs, Analytics | Labor |
| Crew Timeline | "How big was the crew week to week?" | Job Detail › Field Data | Labor |
| Overtime KPIs | "How much OT and how many anomalies?" | Job Detail › Field Data | Labor |
| Worker Heatmap | "Who worked when?" | Job Detail › Field Data | Labor |
| Equipment Matrix | "What equipment is on this job?" | Job Detail › Field Data, All Jobs, Analytics | Equipment |
| Daily Report Calendar | "Did we file reports every day?" | Job Detail › Field Data, Analytics | Field activity |
| Sub Timeline | "When was each sub on site?" | Job Detail › Field Data | Field activity |
| Weather Impact | "Did weather slow us down?" | Job Detail › Field Data | Weather |
Labor Cost Code Bars
One-line purpose — Labor cost on this job, broken down by cost code.
Where you'll see it — Job Detail.
What it shows — Up to 15 horizontal bars, one per cost code, sorted by labor cost descending. A single "Other (N)" bar at the bottom aggregates everything past the top 15. Bar labels are truncated to 24 characters with an ellipsis when names get long.
Tier 2 controls — None.
Drill — Click any cost-code bar to emit a cost-code filter chip; the PO Detail table on the same job narrows to that cost code. Clicking the "Other (N)" bar is a silent no-op because it has no single underlying cost code.
Labor Hours vs Cost Scatter
One-line purpose — Spot jobs that are paying more per hour than the rest of the portfolio.
Where you'll see it — All Jobs, Analytics.
What it shows — A scatter plot, one dot per job. X-axis is total hours worked; Y-axis is total labor cost. Jobs above the visual trend are paying more per hour than the rest. The tooltip carries job name, job number, hours, and labor cost.
Tier 2 controls — None.
Drill — Hover only.
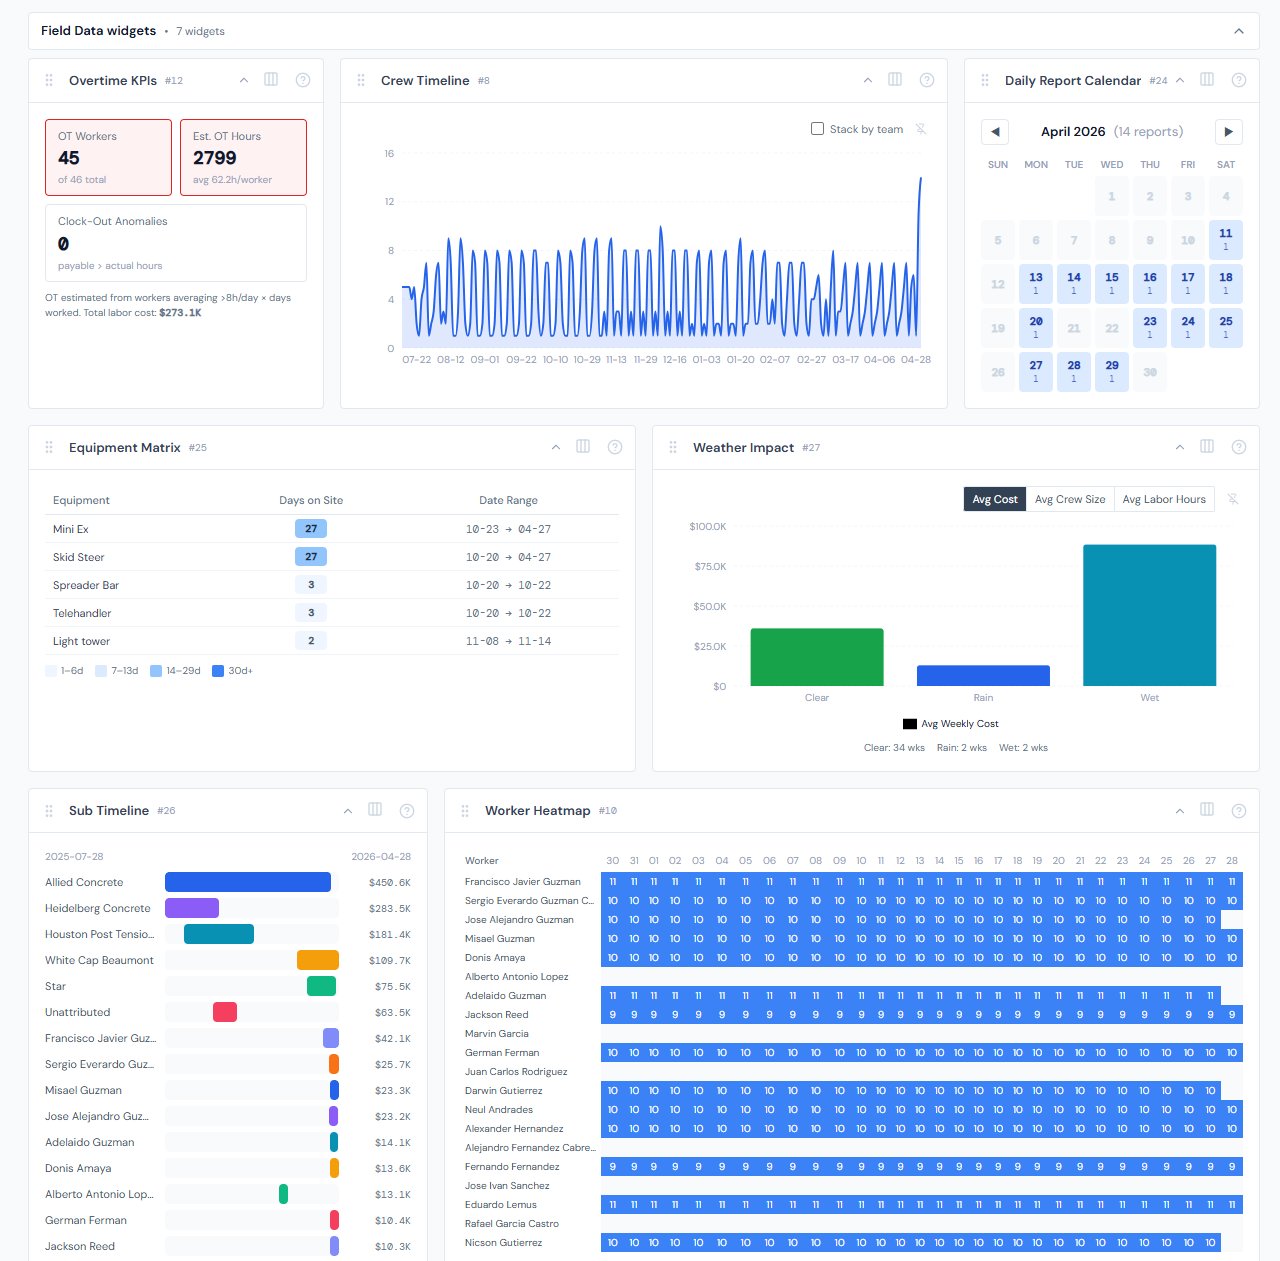
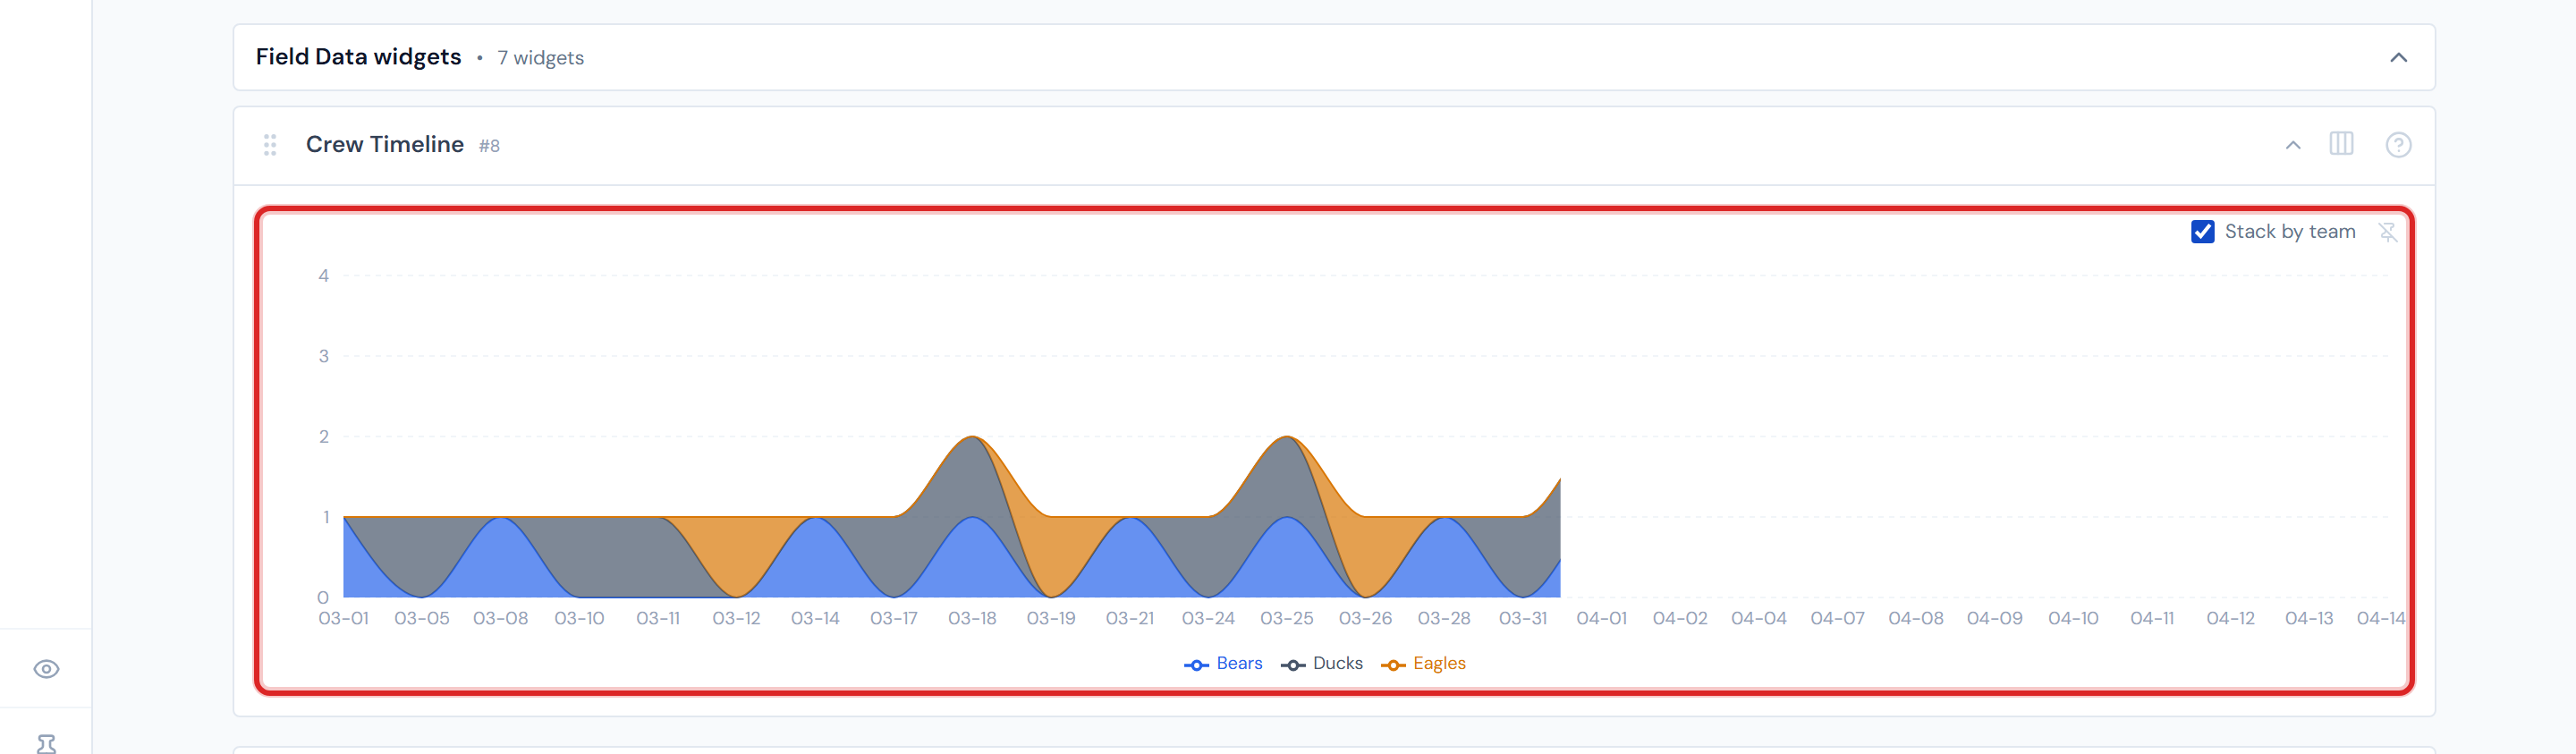
Crew Timeline
One-line purpose — Daily / weekly crew size on this job, optionally split by team.
Where you'll see it — Job Detail › Field Data.
What it shows — An area chart bucketed into 7-day weeks. Two modes: flat (one area for total crew size) and stacked by team (one area per team color). Dips correspond to weeks with fewer workers — holidays, weather, demobilization.
Tier 2 controls — A Stack by team toggle (pinnable).
Drill — Hover only.
Reading note — Crew size is bucketed at 7-day granularity. A worker who worked any day inside a 7-day window contributes 1 to that week's count. For day-by-day grain, use Worker Heatmap below.
Overtime KPIs
One-line purpose — Surface labor exceptions that cost money — high OT and clock-out anomalies.
Where you'll see it — Job Detail › Field Data.
What it shows — A small grid of KPI cards. The most important ones:
- OT Workers — count of workers averaging more than 8 hours in a day
- Total OT Hours — sum of overtime hours across the job
- Avg OT per OT worker — how much overtime each affected worker has logged
- Clock-Out Anomalies — count of workers whose payable-hours figure exceeds their actual-hours figure (possible time-card cleanup needed)
Cards turn red when their metric reads as a problem.
Tier 2 controls — None.
Drill — None.
Overtime is computed against an 8-hour day, not a 40-hour week. A worker who puts in 9-hour days for 5 days is flagged with 5 hours of OT, not zero. If you're used to a payroll-week 40-hour OT convention, this widget will read different — it's flagging long days, not long weeks.
Worker Heatmap
One-line purpose — A day-by-day grid of which worker put in how many hours.
Where you'll see it — Job Detail › Field Data.
What it shows — Up to 20 workers (rows) × the last 30 days (columns). Each cell is colored by hours: empty (no work), light blue (under 4 hrs), medium blue (4–8 hrs), dark blue (8+ hrs). Gaps in a worker's row are days off, sick days, weather days, or layoffs.
Tier 2 controls — None.
Drill — Hover only.
Cells fill each worked date with the worker's average daily hours, not the actual hours for that specific day. So a worker who averaged 7.5 hrs/day across 20 days reads 7.5 in every cell of those 20 days. Use this widget to spot patterns and gaps, not to verify individual timesheets — the daily-grain truth lives in the timeclock data, not the heatmap visualization.
Equipment Matrix
One-line purpose — Equipment activity on this job — what's been on site and for how long.
Where you'll see it — Job Detail › Field Data, All Jobs, Analytics. On the portfolio pages it politely defers — see below.
What it shows — A table with three columns: Equipment, Days on Site, Date Range. Sorted by Days on Site descending. The Days on Site cell is shaded by intensity: light blue under 7 days, medium 7–14, blue 14–30, dark 30+.
Tier 2 controls — None.
Drill — Hover for the date-range tooltip; no click navigation.
On All Jobs and Analytics, this widget shows an "open a specific job to see its equipment" message rather than aggregating across the portfolio. There's no portfolio-wide equipment view today — that's a planned enhancement, not a missing feature.
Daily Report Calendar
One-line purpose — Spot gaps in daily-report submissions.
Where you'll see it — Job Detail › Field Data, Analytics.
What it shows — A calendar-month grid (Sunday-through-Saturday columns). Each day cell is colored by report count using a 4-step blue intensity (more reports = darker cell); empty days render flat slate. Month-navigation controls sit at the top of the widget.
Tier 2 controls — None.
Drill — On Job Detail › Field Data, click a day to open that job's daily reports filtered to that date. On Analytics, clicking a day is a silent no-op — there's no specific job to drill into without a job in scope.
The widget behaves differently on portfolio pages than on Job Detail. On Analytics, clicks are no-ops — that's intentional, not broken.
Sub Timeline
One-line purpose — Show when each subcontractor was active on this job.
Where you'll see it — Job Detail › Field Data.
What it shows — One horizontal bar per sub vendor, positioned across a min-to-max date range. The right edge of each bar is the vendor's last PO date; the left edge is back-estimated from the vendor's relative spend share. Each bar is at least 5% of the chart width so even small subs are visible. Bar colors are decorative, not categorical.
Tier 2 controls — None.
Drill — Hover for vendor name, total cost, PO count.
Bar widths are estimated from vendor spend, not measured site-presence. Treat this as a rough activity-window view, not as ground-truth attendance — the data feed has a vendor's last PO date, but no per-vendor start date, so the left edge is approximated.
Weather Impact
One-line purpose — Correlate weather conditions with labor activity or cost.
Where you'll see it — Job Detail › Field Data.
What it shows — A bar chart with four weather conditions on the X-axis (Clear, Rain, Wet, EXTREME HEAT) and your chosen metric on the Y-axis. Each week is assigned to its dominant weather condition, then metrics are averaged across weeks per condition.
Tier 2 controls — A Metric segmented toggle (pinnable): Avg Cost / Avg Crew Size / Avg Labor Hours.
Drill — Hover only.
Each week is assigned to its dominant weather condition — the one with the most days that week. A mostly-clear week with two rain days and two wet days counts entirely as a "Clear" week. The math doesn't fractionally allocate, so a rainy stretch with a single sunny day will skew Clear.
If a job has no recorded weather rows for one of the 4 conditions, that bar simply won't appear — that's not a data error, it's the absence of that condition on this job.
Hiding and showing widgets
Most field widgets aren't fixed in place. Use the gear icon on the page (the Widget Settings panel) to toggle which ones appear. The bulk of these live on Job Detail › Field Data — see the widgets overview for the mechanic.
Related reading
- Field Data tab — the home page for most of these widgets
- Spend widgets — for the cost angle on labor (Cost Waterfall's Labor bar is the same dollars as Labor Cost Code Bars)
- Budget & billing widgets — for the "are we over on labor budget?" angle
- Portfolio widgets — for the portfolio-spread view that complements field rollups
- Categories — for the cost-code → category mapping that Labor Cost Code Bars implicitly depends on
- Data refresh rates — labor and field data refresh nightly; cost-derived field widgets follow the 4-hour cost-data refresh
- Troubleshooting — for the "widget shows empty on portfolio page" navigation
- The filter banner — page filters affect the portfolio field widgets