Alert & Briefing Widgets
Two widgets designed to be the first thing you look at when you open the app — a daily Morning Briefing summary and a running Anomaly Feed for unusual activity. Both surface what needs attention before you go hunting.
This is the smallest catalog page (just two widgets), but they earn their own page because they share a "what changed since you last looked?" mental model that's distinct from the analytical widgets in the other catalog pages.
These two widgets are designed to live at the top of your Action Queue or All Jobs page. Most PMs put them first so they're the first thing they see when the app opens.
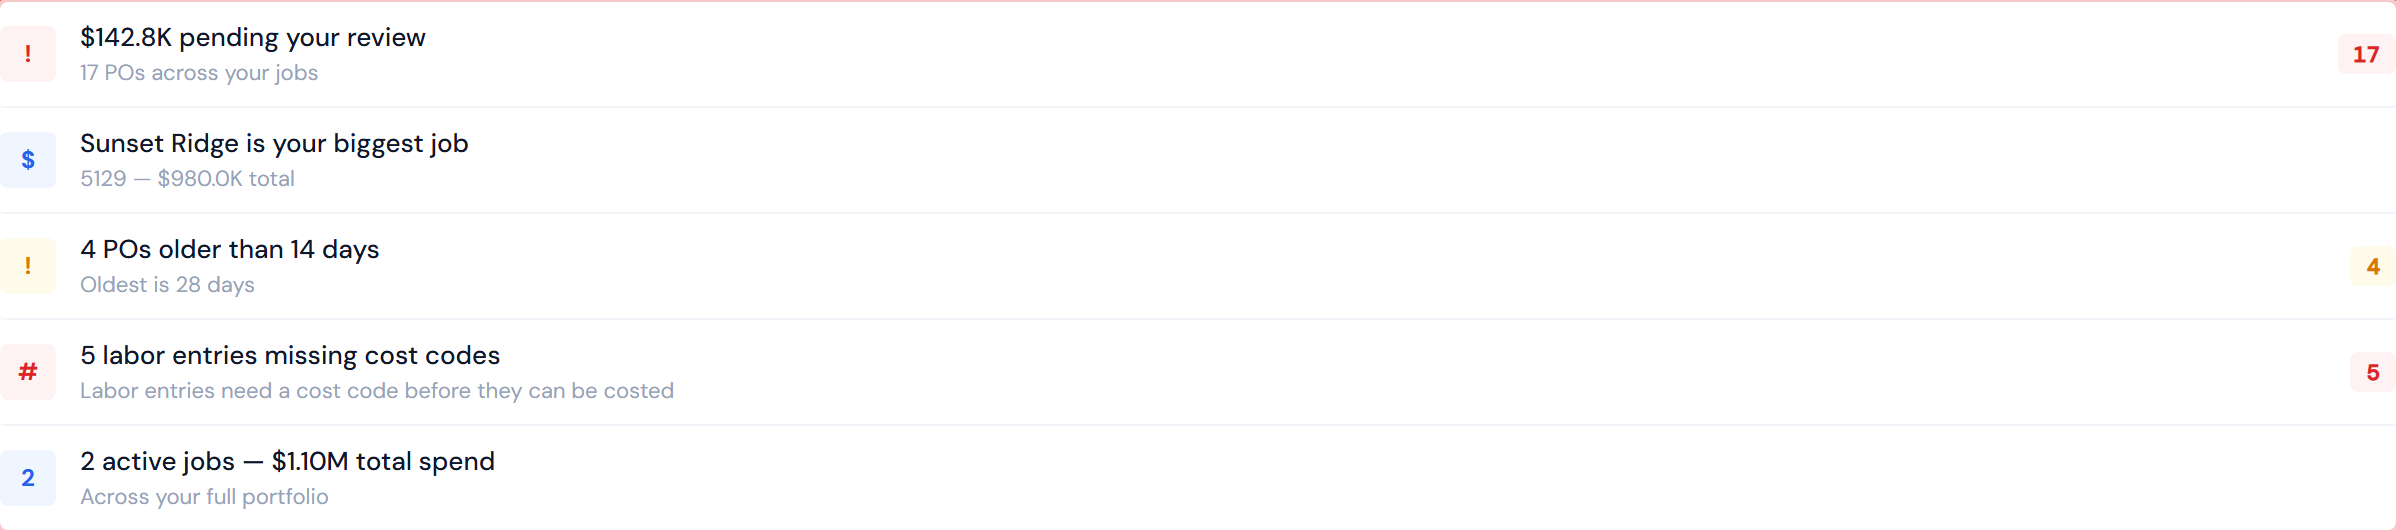
Stale PO Strip is alert-shaped too — it surfaces aging POs in your queue. It lives on the vendor catalog page because PMs think of stale POs as a vendor-and-PO concern, but it's a natural neighbor to these two.
At a glance
| Widget | Best for | Page(s) | Style |
|---|---|---|---|
| Morning Briefing | "What should I do first today?" | All Jobs, Action Queue | Narrative summary |
| Anomaly Feed | "What unusual events showed up overnight?" | All Jobs, Action Queue | Running event list |
Morning Briefing
One-line purpose — A short narrative of "what changed across your jobs," designed to be read in 30 seconds at the start of the day.
Where you'll see it — All Jobs, Action Queue.
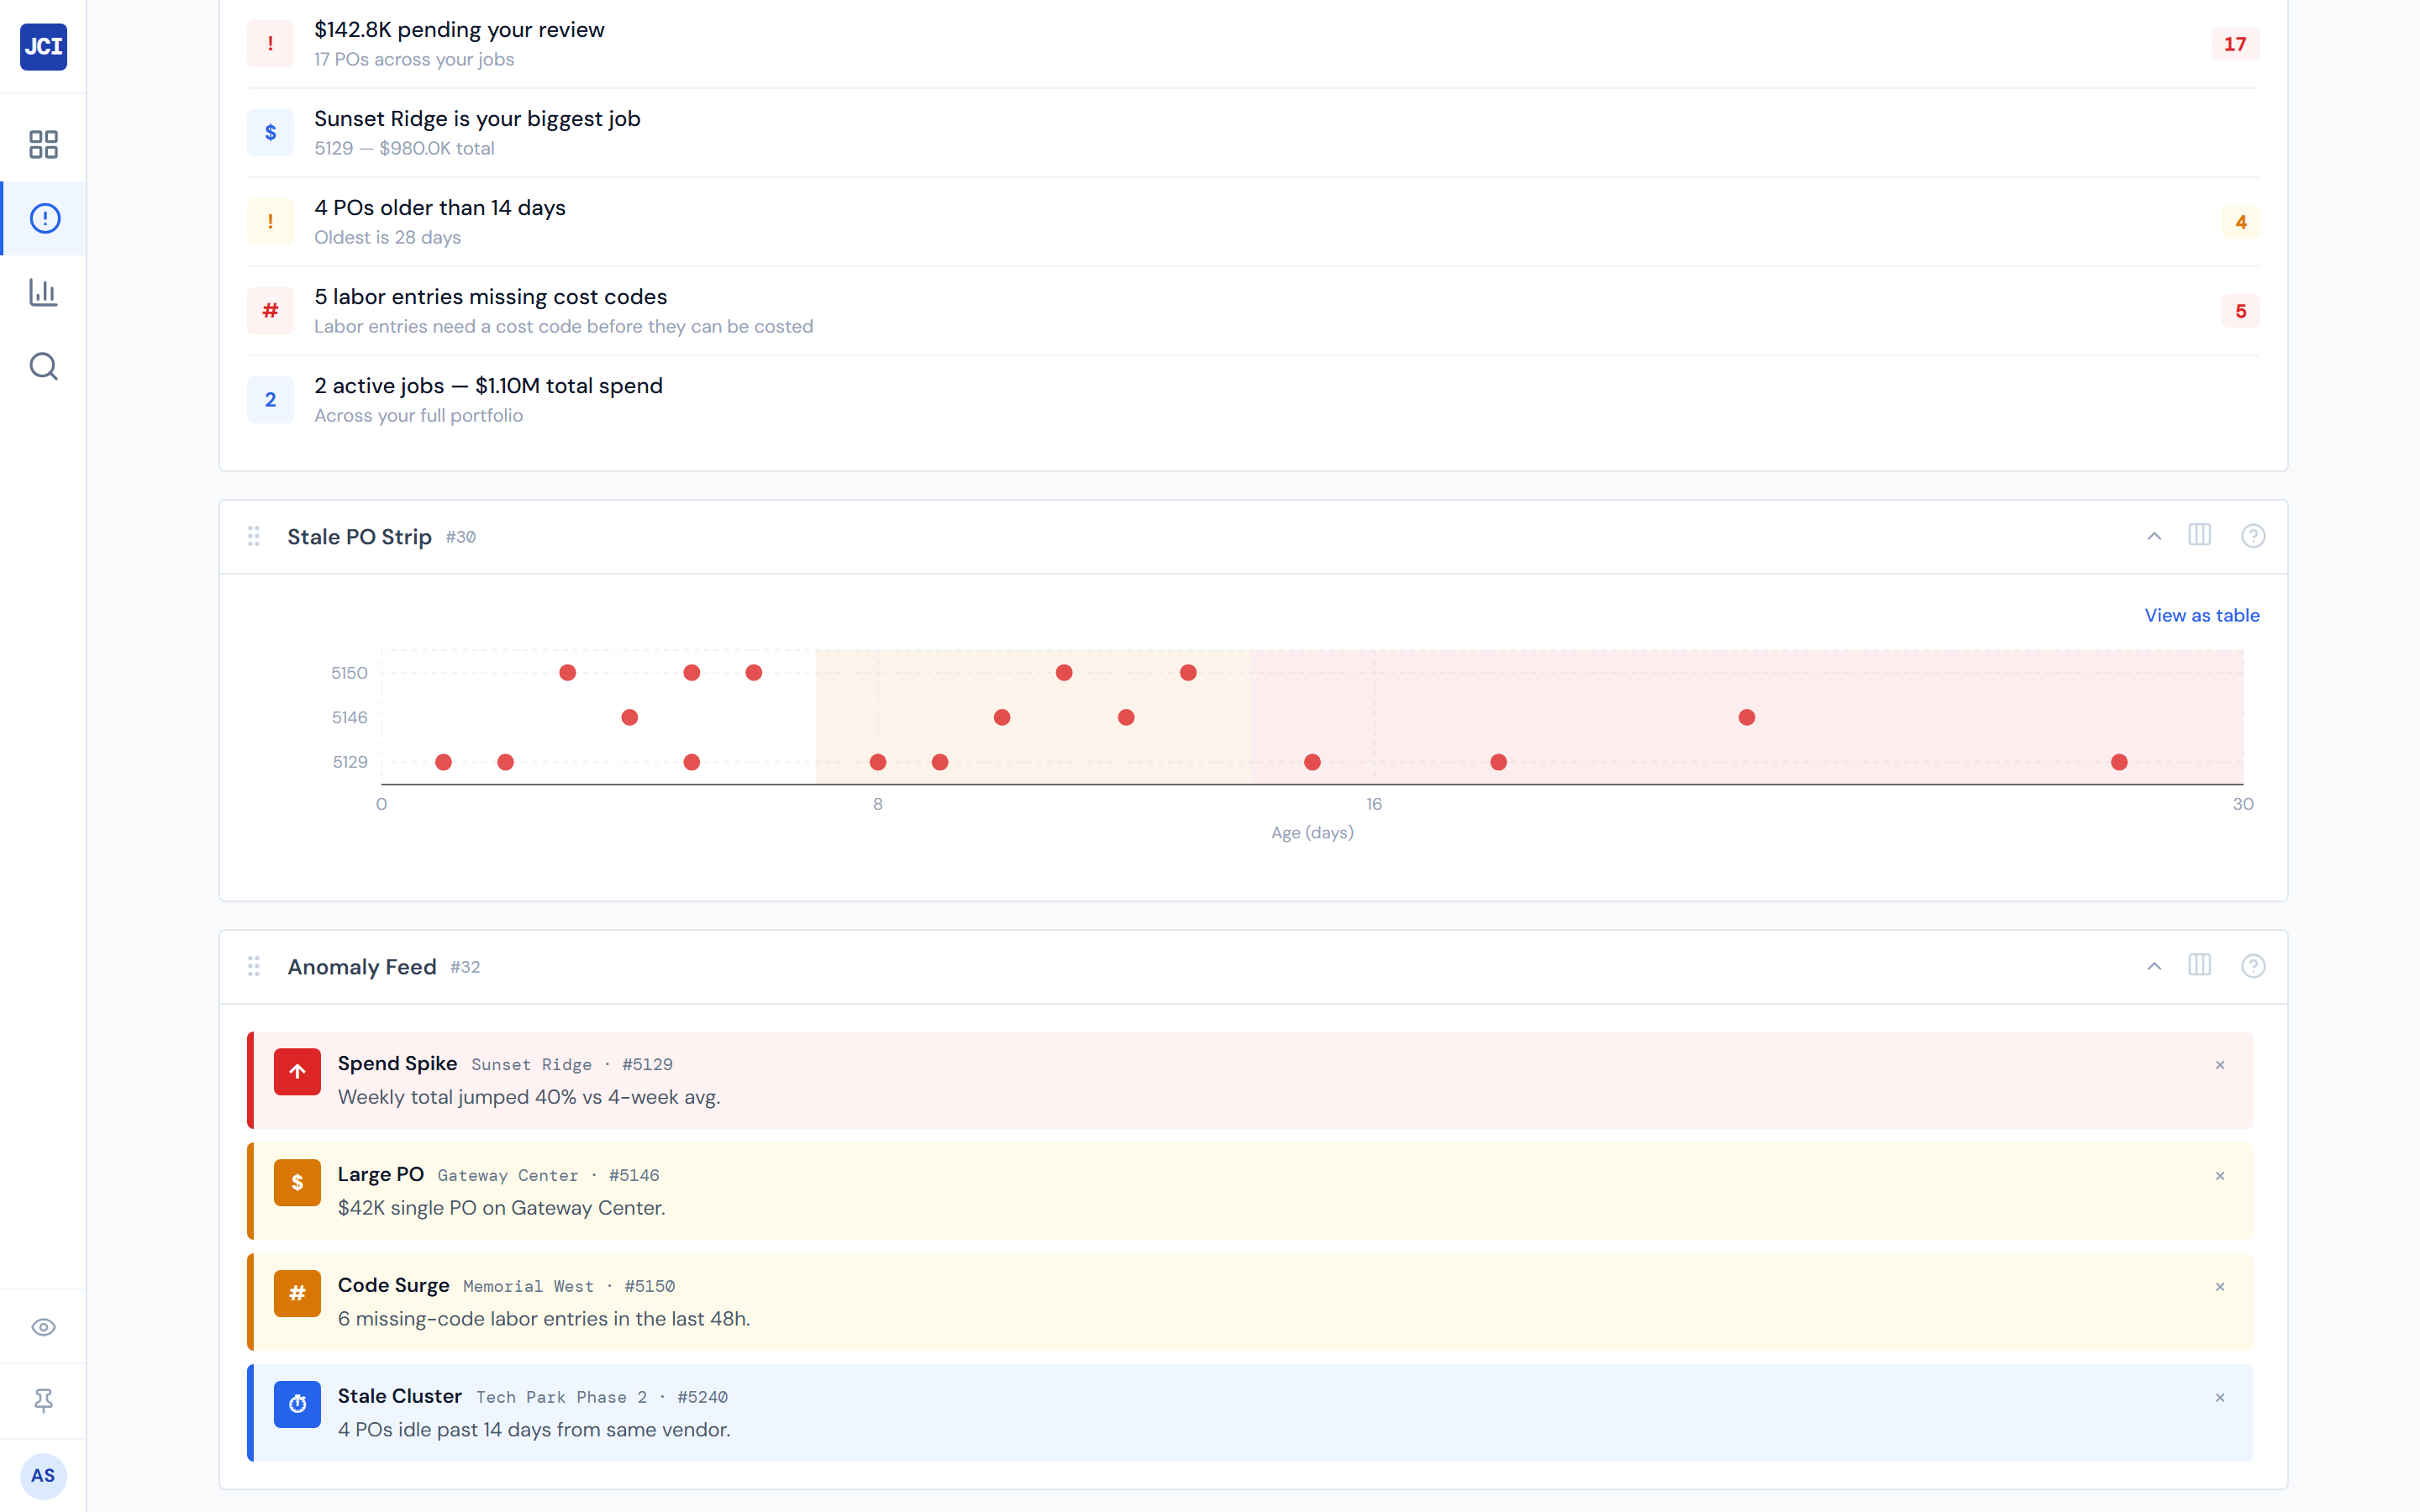
What it shows — A list of small bullet rows, each with an icon, a label, an optional detail line, and a colored badge with the headline number. Typical rows include:
- Pending PO count and dollars
- Count of POs missing cost codes
- Total cost across your jobs
- Your top job by spend
- Count of stale POs (over 14 days old)
- Age of the oldest stale PO
The exact set of rows depends on what's actually non-zero in your data — empty data points are suppressed so the widget gets shorter when you're caught up.
Tier 2 controls — None.
Drill — Each row is a clickable button that navigates to the relevant part of the app — your action queue, the related job's detail page, the missing-codes list, etc. The icon, label, and badge tell you what you're about to open.
Rows with zero values are suppressed. A short briefing means you're caught up — not that the widget broke.
"Top job" is the job with the highest total cost in your filtered set. It's not a recommendation or a problem-job indicator — just the biggest one by spend.
Reads from your personal action queue. A viewer with no PM identity in the directory will see an empty briefing — that's expected, not a bug.
Stale threshold — When Morning Briefing counts "stale POs," it uses the same over-14-days threshold the action queue uses. A PO that's 13 days old won't count as stale here even if it might in some other display.
Anomaly Feed
One-line purpose — A running list of unusual spend events the system spots automatically.
Where you'll see it — All Jobs, Action Queue.
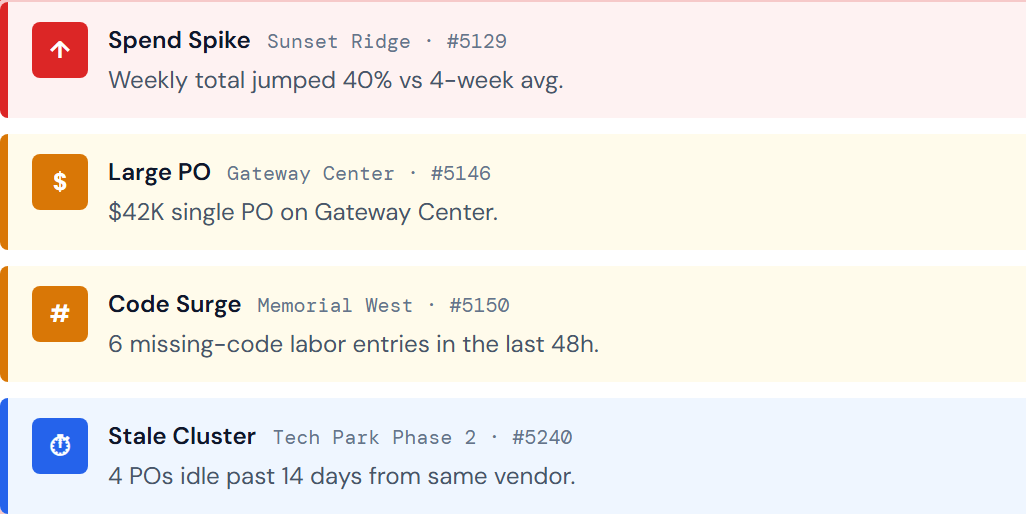
What it shows — A scrollable list of anomaly cards. Each card has:
- An icon and type label for the anomaly category — one of four:
- Spend Spike — sudden weekly spend jump
- Large PO — an outsized individual PO
- Code Surge — cost-code activity jumping out of pattern
- Stale Cluster — a knot of stale POs on one job
- A severity badge — HIGH (red), MEDIUM (amber), or LOW (blue)
- The triggering job number (and PO order ID for Large PO anomalies)
- A dismiss button
Tier 2 controls — None. There's no built-in severity filter — the widget shows every severity by default and you dismiss individual cards.
Drill — Click a card to navigate to the triggering job. For Large PO anomalies, you land directly on that PO inside the job's PO Detail tab.
Dismissing a card is session-only. It will reappear after a refresh — that's intentional, so anomalies you didn't actually fix don't fall off your radar. Use the click to open the triggering job and resolve it at the source, rather than treating dismiss as a permanent action.
Anomaly type catalog — Exactly four types today: Spend Spike, Large PO, Code Surge, Stale Cluster. If a fifth type starts appearing in the feed, the underlying detection has been extended. A type you don't recognize is worth a ticket so the icon and friendly label can catch up.
Where they fit in the day
Most PMs mount one or both at the top of their All Jobs or Action Queue page so they're the first thing they see when the app opens. Morning Briefing tells you what's worth doing first; Anomaly Feed tells you what changed that you didn't ask about.
Both widgets respect the page's filter bar (My Jobs, company, date range). Filter the page narrower and the briefing and feed get quieter. That's a feature — if you only manage 10 jobs, scope to them and the noise drops accordingly.
See the widgets overview for how to mount and arrange them.
Related reading
- Vendor widgets — for Stale PO Strip, the third alert-shaped widget
- Action Queue overview — the queue concept that both widgets surface
- Pending my action — where the action items Morning Briefing surfaces actually live
- Missing cost codes — where the missing-codes count drills to
- My Jobs vs All Jobs — for the PM-identity context that affects both widgets' scope
- Data refresh rates — anomaly detection runs against the same materialized cost data, so an anomaly may not register until the next 4-hour refresh
- Troubleshooting — for the empty-briefing or empty-feed pathways
- The filter banner — how page filters cascade into both widgets
- My Jobs toggle — most readers pair My Jobs with these widgets to scope to their book