Budget & Billing Widgets
Seven widgets that answer the questions: are we on budget? are we billing fast enough? are we making margin? They share two prerequisites — a contract value entered on Budget Entry, and (for the billing widgets) at least one payapp on Billing Tracker. Without one or both, several widgets show "no data yet — go enter X" empty states rather than real numbers.
Two prerequisites unlock most of these widgets — enter a contract value on Budget Entry, and at least one payapp on Billing Tracker. Until you do, you'll see "enter X to see Y" messages.
At a glance
| Widget | Best for | Page(s) | Needs |
|---|---|---|---|
| Budget vs Actual | "Which categories are over?" | Job Detail › Budget | Budget |
| Cost to Complete | "Where is the rest of the budget going?" | Job Detail › Budget | Budget |
| Job Health Gauge | "How much of contract value have we spent?" | Job Detail | Contract value |
| Gross Margin | "Is this job paying?" | Job Detail, Job Detail › Budget | Contract value |
| Billing Waterfall | "Where are we in the billing flow?" | Job Detail › Budget | Payapps |
| Billing Efficiency | "Are we billing as fast as spending?" | Job Detail › Budget, All Jobs | Payapps |
| Retainage Exposure | "How much is held back?" | Job Detail › Budget, Analytics | Payapps |
Budget vs Actual
One-line purpose — Category-level variance from budget — see which categories are over or under and by how much.
Where you'll see it — Job Detail › Budget.
What it shows — One horizontal bar per category that has either a budget or actual amount over $0, sorted by absolute variance descending. Bars to the right of the zero-line are under budget (green); bars to the left are over budget (red). The tooltip always shows Budget, Actual, and Variance together — in both dollars and percent — so you can sanity-check a sign before acting on it.
Tier 2 controls — A $ Variance / % Variance segmented toggle (pinnable).
Drill — Click any bar to emit a category filter chip; the PO Detail table on the same job narrows to that category.
Empty state — "No budget entered yet — use the Budget Entry tab to add estimates for this job."
Sign convention: positive variance = under budget = green. The tooltip always shows Budget, Actual, and Variance together so you can sanity-check the sign before acting. This matches construction-finance convention but reverses the math instinct that "actual minus budget" should be the figure of interest.
Cost to Complete
One-line purpose — Per-category snapshot of how much you've spent, how much budget is left, and any overrun.
Where you'll see it — Job Detail › Budget.
What it shows — One stacked bar per category. Spent (dark slate) caps at the budget amount. Remaining Budget (light slate) is whatever's left. Overrun (red) only appears when actual exceeds budget — and visually extends the bar past the budget line so you can see how much over you are. Sorted by total exposure (budget + overrun) descending.
Tier 2 controls — None.
Drill — None.
Empty state — "No budget entered yet — use the Budget Entry tab to add estimates so we can project cost to complete."
Reading note — The "Remaining Budget" segment is budget headroom, not a forecast of remaining spend. If a category is already over budget, remaining shows as $0 and any overspend lives in the red Overrun segment.
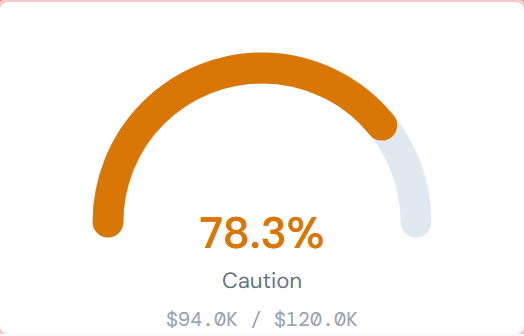
Job Health Gauge
One-line purpose — One-glance share of contract value spent.
Where you'll see it — Job Detail.
What it shows — A half-doughnut gauge from 0 to 100% with three color zones — green under 70% (On Track), amber 70–90% (Caution), red 90% and above (Critical). The percentage is shown big in the gauge color.
Tier 2 controls — None.
Drill — None.
Empty state — "No contract value set — enter it on the Budget Entry tab to see health."
Thresholds are finance-tight: green / amber / red zones change at 70 and 90, not at 80 and 100. Don't memorize "green = good" alone — the cutoff matters.
Gross Margin
One-line purpose — Contract value minus actual cost, shown as a dollar figure and a percent.
Where you'll see it — Job Detail and Job Detail › Budget.
What it shows — A big percent (for example, 8.3%), the dollar figure next to it, then a horizontal progress bar in the zone color. Zones are green above 15% (Healthy), amber 5–15% (Tight), red below 5% (At risk).
Tier 2 controls — None.
Drill — None.
Empty state — "No contract value set — enter it on the Budget Entry tab to see margin."
Thresholds at 5 and 15 — not round numbers. At risk under 5%, Tight 5–15%, Healthy above 15%. These are industry-tight cutoffs; quote them exactly when discussing.
Reading note — Gross Margin sums across everything that's been spent, including auto-confirmed labor lines. So margin is reported against actual cost, not just formally costed cost. If you're looking for a "what if pending POs land?" number, that's a separate calculation.
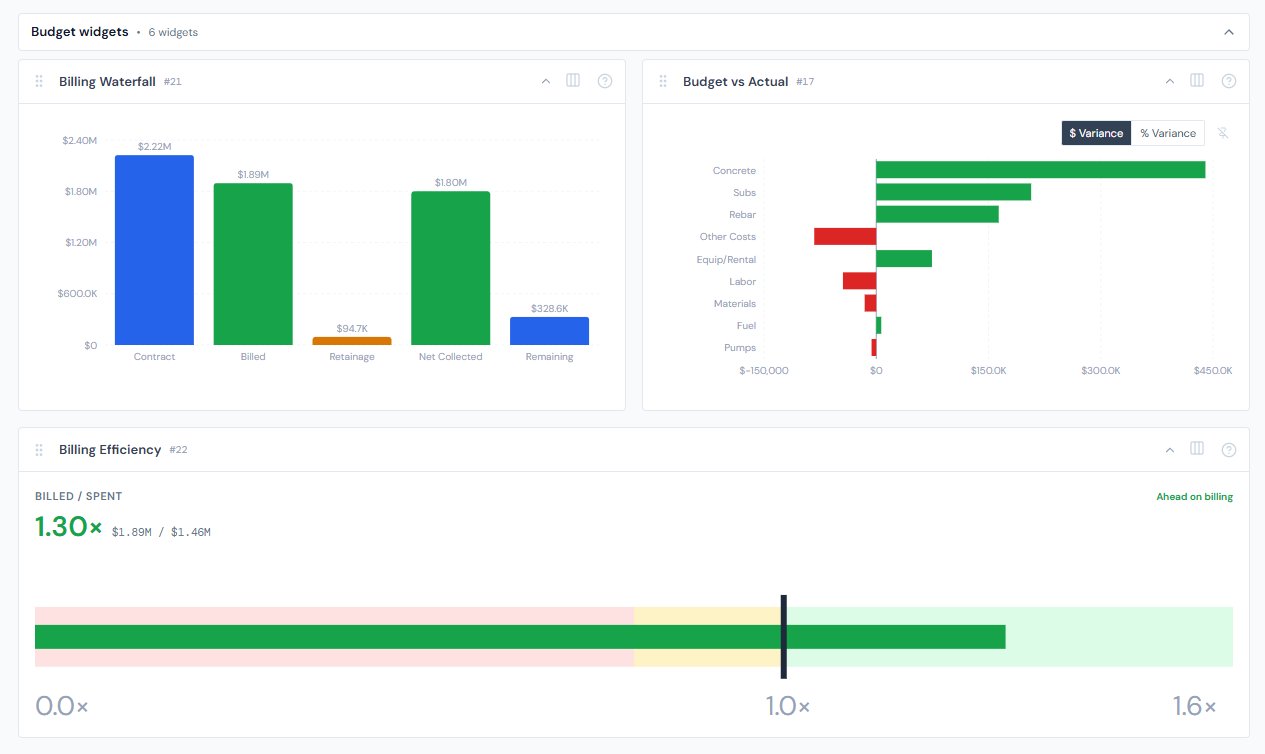
Billing Waterfall
One-line purpose — Five-bar walk from contract value to remaining-to-bill.
Where you'll see it — Job Detail › Budget.
What it shows — Five bars side by side: Contract (blue), Billed (green), Retainage (amber), Net Collected (green), Remaining (blue). Each bar has its dollar value labeled on top.
Tier 2 controls — None.
Drill — None.
Empty state — "No billing periods recorded — use the Billing Tracker tab to add payapps and see the waterfall."
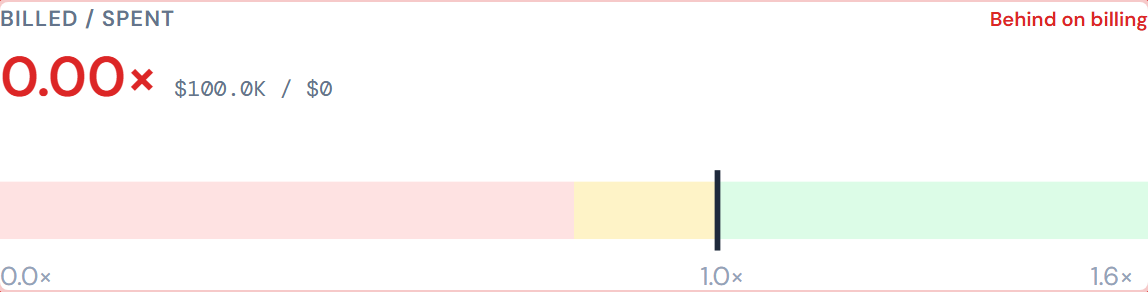
Billing Efficiency
One-line purpose — One-number ratio of billed dollars over spent dollars, shown as a bullet chart.
Where you'll see it — Job Detail › Budget, All Jobs.
What it shows — A horizontal bullet chart, scale 0 to 1.6×. The background is split into three colored zones: red below 0.8× (Behind on billing), amber 0.8–1.0× (Keeping up), green at or above 1.0× (Ahead on billing). A black vertical line marks the 1.0× target. The ratio (1.04×, 0.86×, etc.) is shown big above the chart in the zone color, with the raw billed and spent dollars next to it.
Tier 2 controls — None.
Drill — None.
Empty state — "No billing data yet — enter the first payapp on the Billing Tracker tab."
The bullet chart caps visually at 1.6×. A job billing 2.0× ahead will look like its bar runs off the end of the chart — that's the visual cap, not a data error. The ratio reading above the chart still shows the true number.
Retainage Exposure
One-line purpose — Dollars held as retainage on this job, plus the percent of billed value being held back.
Where you'll see it — Job Detail › Budget, Analytics.
What it shows — A big dollar figure of total retainage held (in amber), then a horizontal progress bar showing what fraction of billed value that represents.
Tier 2 controls — None.
Drill — None.
Empty state on Job Detail — "No retainage recorded — use the Billing Tracker tab to enter payapps with retainage held."
Empty state on Analytics — "Portfolio retainage summary needs billing data entered across jobs. For now, open a specific job to see its retainage."
On the Analytics page, this widget shows an "open a specific job" message instead of a portfolio number. Portfolio aggregation is a planned future enhancement, not a missing feature.
Variance color convention
Across every variance widget on this page, green = under budget / on the upside, red = over budget / behind. This is intentional but counter to a reader's instinct that "green up = bigger." For the threshold widgets (Job Health Gauge, Gross Margin, Billing Efficiency), the relationship is non-linear — each has its own cutoffs:
| Widget | Green | Amber | Red |
|---|---|---|---|
| Job Health Gauge | Under 70% | 70–90% | 90%+ |
| Gross Margin | Above 15% | 5–15% | Under 5% |
| Billing Efficiency | At or above 1.0× | 0.8–1.0× | Under 0.8× |
When in doubt, hover any bar — the tooltip carries the absolute numbers and the explicit sign so you can read the truth instead of the color.
A note on data freshness
Cost data refreshes every 4 hours; budget and billing entries you type in update immediately. So a fresh payapp shows up in the billing widgets at once, but the matching cost increase from new POs may lag a few hours. See data refresh rates for the full cadence.
Hiding and showing widgets
Widget visibility is controlled per-page via the gear icon. See the widgets overview.
Related reading
- Budget Entry — where contract value is entered
- Billing tracker — where payapps are entered
- Categories — explains why budget uses 9 categories but POs use 7
- Spend widgets — for the time-series view of the same money
- Portfolio widgets — Job Health Gauge cross-lists there too
- PO lifecycle colors — the variance widgets borrow conceptual color logic; the Approved Change Order green is also documented there
- Data refresh rates — for the 4-hour cost-data freshness
- Troubleshooting �— for the empty-state navigation
- The filter banner — page filters affect cost-side data on these widgets