Vendor Widgets
Seven widgets that view your spending through the vendor and PO lens — top vendors by spend, vendor pricing variance, brand-new vendors, where POs sit in the lifecycle, what's getting old in your queue, and which jobs have the most change orders.
The seven fall into three loose groups: vendor spend (Pareto, Box Plot, New Vendor Alert), PO pipeline (Pipeline Funnel, Stale PO Strip, Vendor Lifecycle), and change-order activity (Change Order Lollipop).
Pick the group that matches your question — vendor spend, PO pipeline, or change-order activity — then pick the widget inside it.
At a glance
| Widget | Best for | Page(s) | Scope |
|---|---|---|---|
| Vendor Pareto | "Who do we spend the most with?" | Job Detail, All Jobs, Analytics | Job or portfolio |
| Vendor Lifecycle | "Whose POs are stuck on this job?" | Job Detail | One job |
| Vendor Box Plot | "Are we paying consistent unit prices?" | All Jobs, Analytics | Portfolio |
| New Vendor Alert | "Who showed up new in the last month?" | All Jobs, Analytics, Action Queue | Portfolio |
| Pipeline Funnel | "Where do POs sit in the lifecycle?" | All Jobs, Analytics | Portfolio |
| Stale PO Strip | "What's old in my action queue?" | Action Queue | Your queue |
| Change Order Lollipop | "Which jobs have the most COs?" | All Jobs, Analytics | Portfolio |
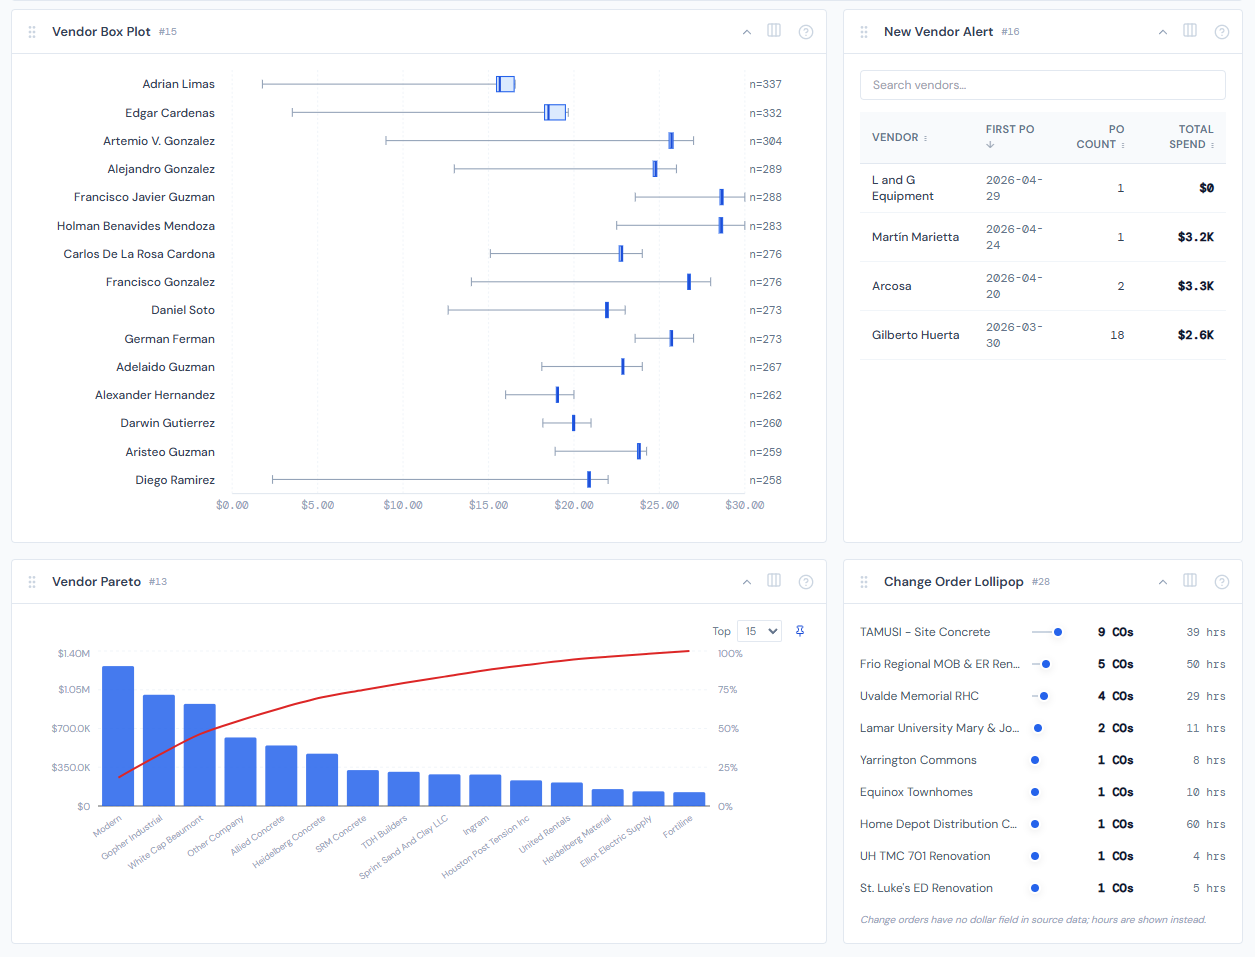
Vendor Pareto
One-line purpose — Top vendors ranked by spend, with a cumulative-percent line so you can spot the 80/20.
Where you'll see it — Job Detail, All Jobs, Analytics. On Job Detail, it's the vendors on this job. On All Jobs and Analytics, it's the vendors across the filtered job set.
What it shows — A combo chart: bars for vendor spend (sorted descending), plus a red cumulative-percent line laid over the top. The tooltip per vendor shows spend, PO count, and the cumulative percentage at that point.
Tier 2 controls — A Top-N selector (10 / 15 / 25 / 50, pinnable). Plus a category filter dropdown that only appears in job-scope mode — see the note below.
Drill — Click any bar. A vendor filter chip appears in the page filter bar, and the PO Detail table on the same page narrows to that vendor.
The category filter dropdown only appears when you're on a job. On All Jobs and Analytics, the widget reads every category by default and the dropdown is hidden.
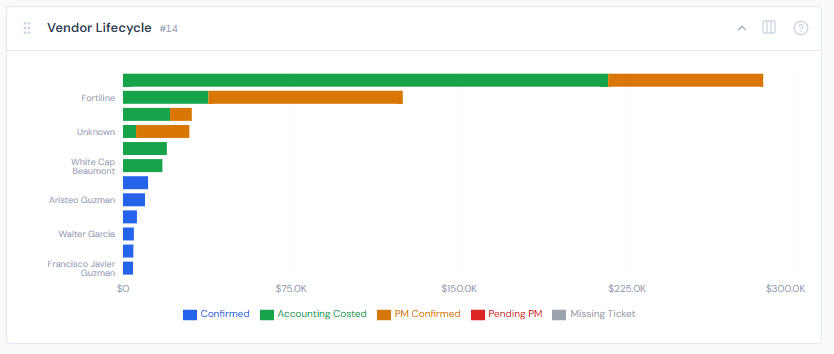
Vendor Lifecycle
One-line purpose — For each top vendor on a job, show how their POs split across the five PO lifecycle statuses.
Where you'll see it — Job Detail.
What it shows — Up to 12 horizontal stacked bars, one per vendor, sorted by total spend descending. Each bar is segmented by the five PO lifecycle colors: Confirmed (blue), Accounting Costed (green), PM Confirmed (amber), Pending PM (red), and Missing Ticket (gray). The tooltip lists each non-zero segment with its dollar value.
Tier 2 controls — None.
Drill — None. Read-only chart.
Reading note — A vendor whose bar is mostly red or gray has POs stuck waiting on action. Mostly blue or green = clean.
Vendor Box Plot
One-line purpose — Show how unit costs vary within each vendor.
Where you'll see it — All Jobs, Analytics.
What it shows — Up to 15 vendors, each rendered as a horizontal box plot of their unit costs: min, Q1, median, Q3, max. Wide spreads mean inconsistent pricing across that vendor's POs.
Tier 2 controls — None.
Drill — None.
Ranked by PO count, not by spend. The widget picks vendors with the most data points so the box plots are statistically meaningful. A vendor with many small POs gets a box; a one-PO mega-vendor won't appear here.
If no vendor has at least one positive unit cost on file, the widget shows an empty-data message rather than a chart.
New Vendor Alert
One-line purpose — Vendors whose first-ever PO landed in the last 30 days.
Where you'll see it — All Jobs, Analytics, Action Queue.
What it shows — A table with four sortable columns: Vendor, First PO date, PO Count, Total Spend. Default sort is First PO descending (newest first). An in-widget search box filters by vendor name as you type.
Tier 2 controls — None. The sort headers and search box are widget-local interactions.
Drill — Click a row to open that vendor's PO in context.
Rolling 30-day window, not a calendar month. A vendor whose first PO was 31 days ago drops off the list automatically.
Pipeline Funnel
One-line purpose — Cross-portfolio view of where POs sit in the lifecycle, by dollars or by count.
Where you'll see it — All Jobs, Analytics.
What it shows — Four bars in lifecycle order: Confirmed / Costed (combined into one bar — the "done" pile), PM Confirmed, Pending PM, Missing Ticket. Each bar uses the PO lifecycle color for its status. A tall Pending PM bar means backed-up confirmations.
Tier 2 controls — A $ vs Count segmented toggle (pinnable), and an Exclude Labor switch.
Drill — Click a stage to open the POs in that stage.
Four bars, not five. Confirmed and Accounting Costed are combined into a single "done" bar. The five-color lifecycle reference still applies — the chart just groups the two end-state colors so the funnel reads as a four-step pipeline.
In $ mode, labor lines (which are auto-confirmed) will dominate the Confirmed/Costed bar by an order of magnitude and visually flatten the rest of the funnel. Toggle Exclude Labor on to surface the materials, sub, and rental pipeline. The toggle isn't a vanity option — it's the only way to read the chart properly in $ mode.
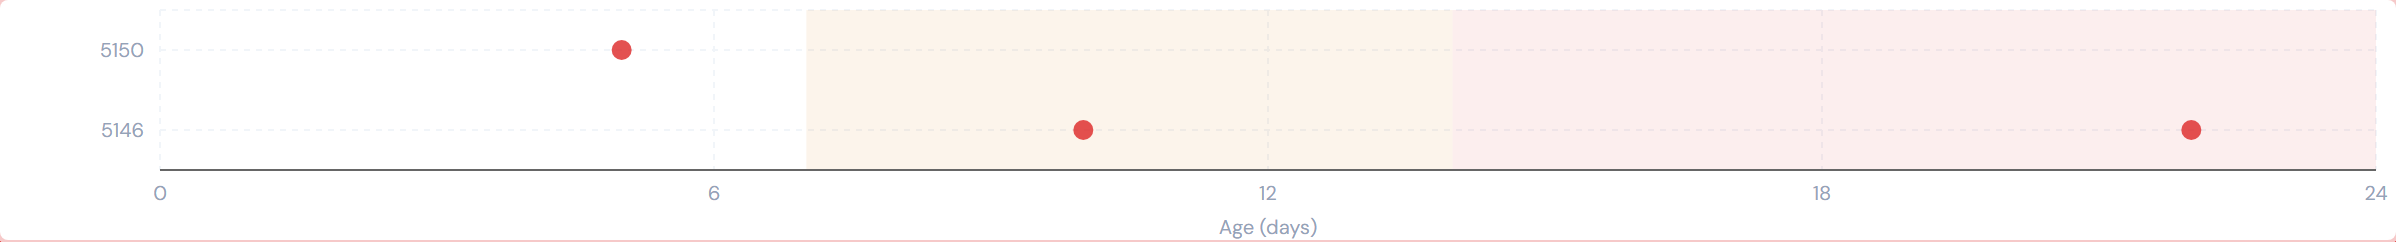
Stale PO Strip
One-line purpose — Visualize how old your unresolved POs are.
Where you'll see it — Action Queue.
What it shows — A scatter strip. Each dot is a PO from your personal queue. The X-axis is age in days; the Y-axis is the job. A red reference area marks "stale" territory. The further right a dot sits, the longer that PO has been waiting.
Tier 2 controls — A View as table / View as chart toggle that swaps the same data into a scrollable table.
Drill — Click a dot or cluster.
Clicking here leaves the current page — it's a hard navigation to the job's detail page, not a filter chip. Your current page filters won't carry over.
This widget shows your queue. If you're signed in as a viewer with no PM identity in the directory, you'll see an empty state — that's expected, not a bug.
Change Order Lollipop
One-line purpose — Rank jobs by change-order count.
Where you'll see it — All Jobs, Analytics.
What it shows — Up to 15 jobs, sorted by CO count descending. Each row has the job name, a horizontal "lollipop" (line plus dot), and a hover tooltip with the actual count.
Tier 2 controls — None.
Drill — Click any row to open that job's detail page.
Like Stale PO Strip, this drill is a hard navigation — it leaves the current page rather than emitting a filter chip. Page filters won't carry over to the job detail page.
Reading note — Bar lengths are relative, not absolute. The longest bar is always rendered at full width and shorter bars are scaled against it. So a job with 8 COs alongside a top job with 80 will look like a tiny stub even though 8 is plenty in absolute terms. The tooltip carries the actual count.
PO lifecycle colors
Two widgets here — Vendor Lifecycle and Pipeline Funnel — share the same five-color PO lifecycle vocabulary. Whenever you see a status color in either of these, it means the same thing it means everywhere else in the dashboard. See PO lifecycle colors for the authoritative list and a quick state diagram.
Hiding and showing widgets
Most vendor widgets aren't fixed in place. Use the gear icon on the page to toggle which ones appear. See the widgets overview for the mechanic.
Related reading
- PO lifecycle colors — the five-color vocabulary used by Vendor Lifecycle and Pipeline Funnel
- Categories — for the category filter on Vendor Pareto
- Data refresh rates — numbers can be up to 4 hours stale
- Action Queue overview — where Stale PO Strip lives
- Pending my action — for the queue concept Stale PO Strip surfaces
- Alert & briefing widgets — Stale PO Strip is alert-shaped; the rest of the alert family lives there
- Portfolio widgets — for cross-job rollups that complement these vendor views
- The filter banner — page filters cascade into all portfolio vendor widgets
- My Jobs toggle — most readers pair My Jobs with vendor widgets to scope to their book