Month-End Review
Once per month, after the month closes, you do a per-job pass on every active job — vs Actual, COs, billing — and a portfolio glance on Analytics. End the pass with a CSV export per major job for accounting.
This page is the checklist.
When this happens
Typically the first week of the new calendar month, after the previous month's data has settled.
Cost data refreshes every four hours. Source data refreshes nightly. If you run the review on the 1st, the previous month's last day may not be fully reflected yet. The 2nd is safer; the 3rd is safer still. See Data Refresh Rates.
The five-step monthly close-out
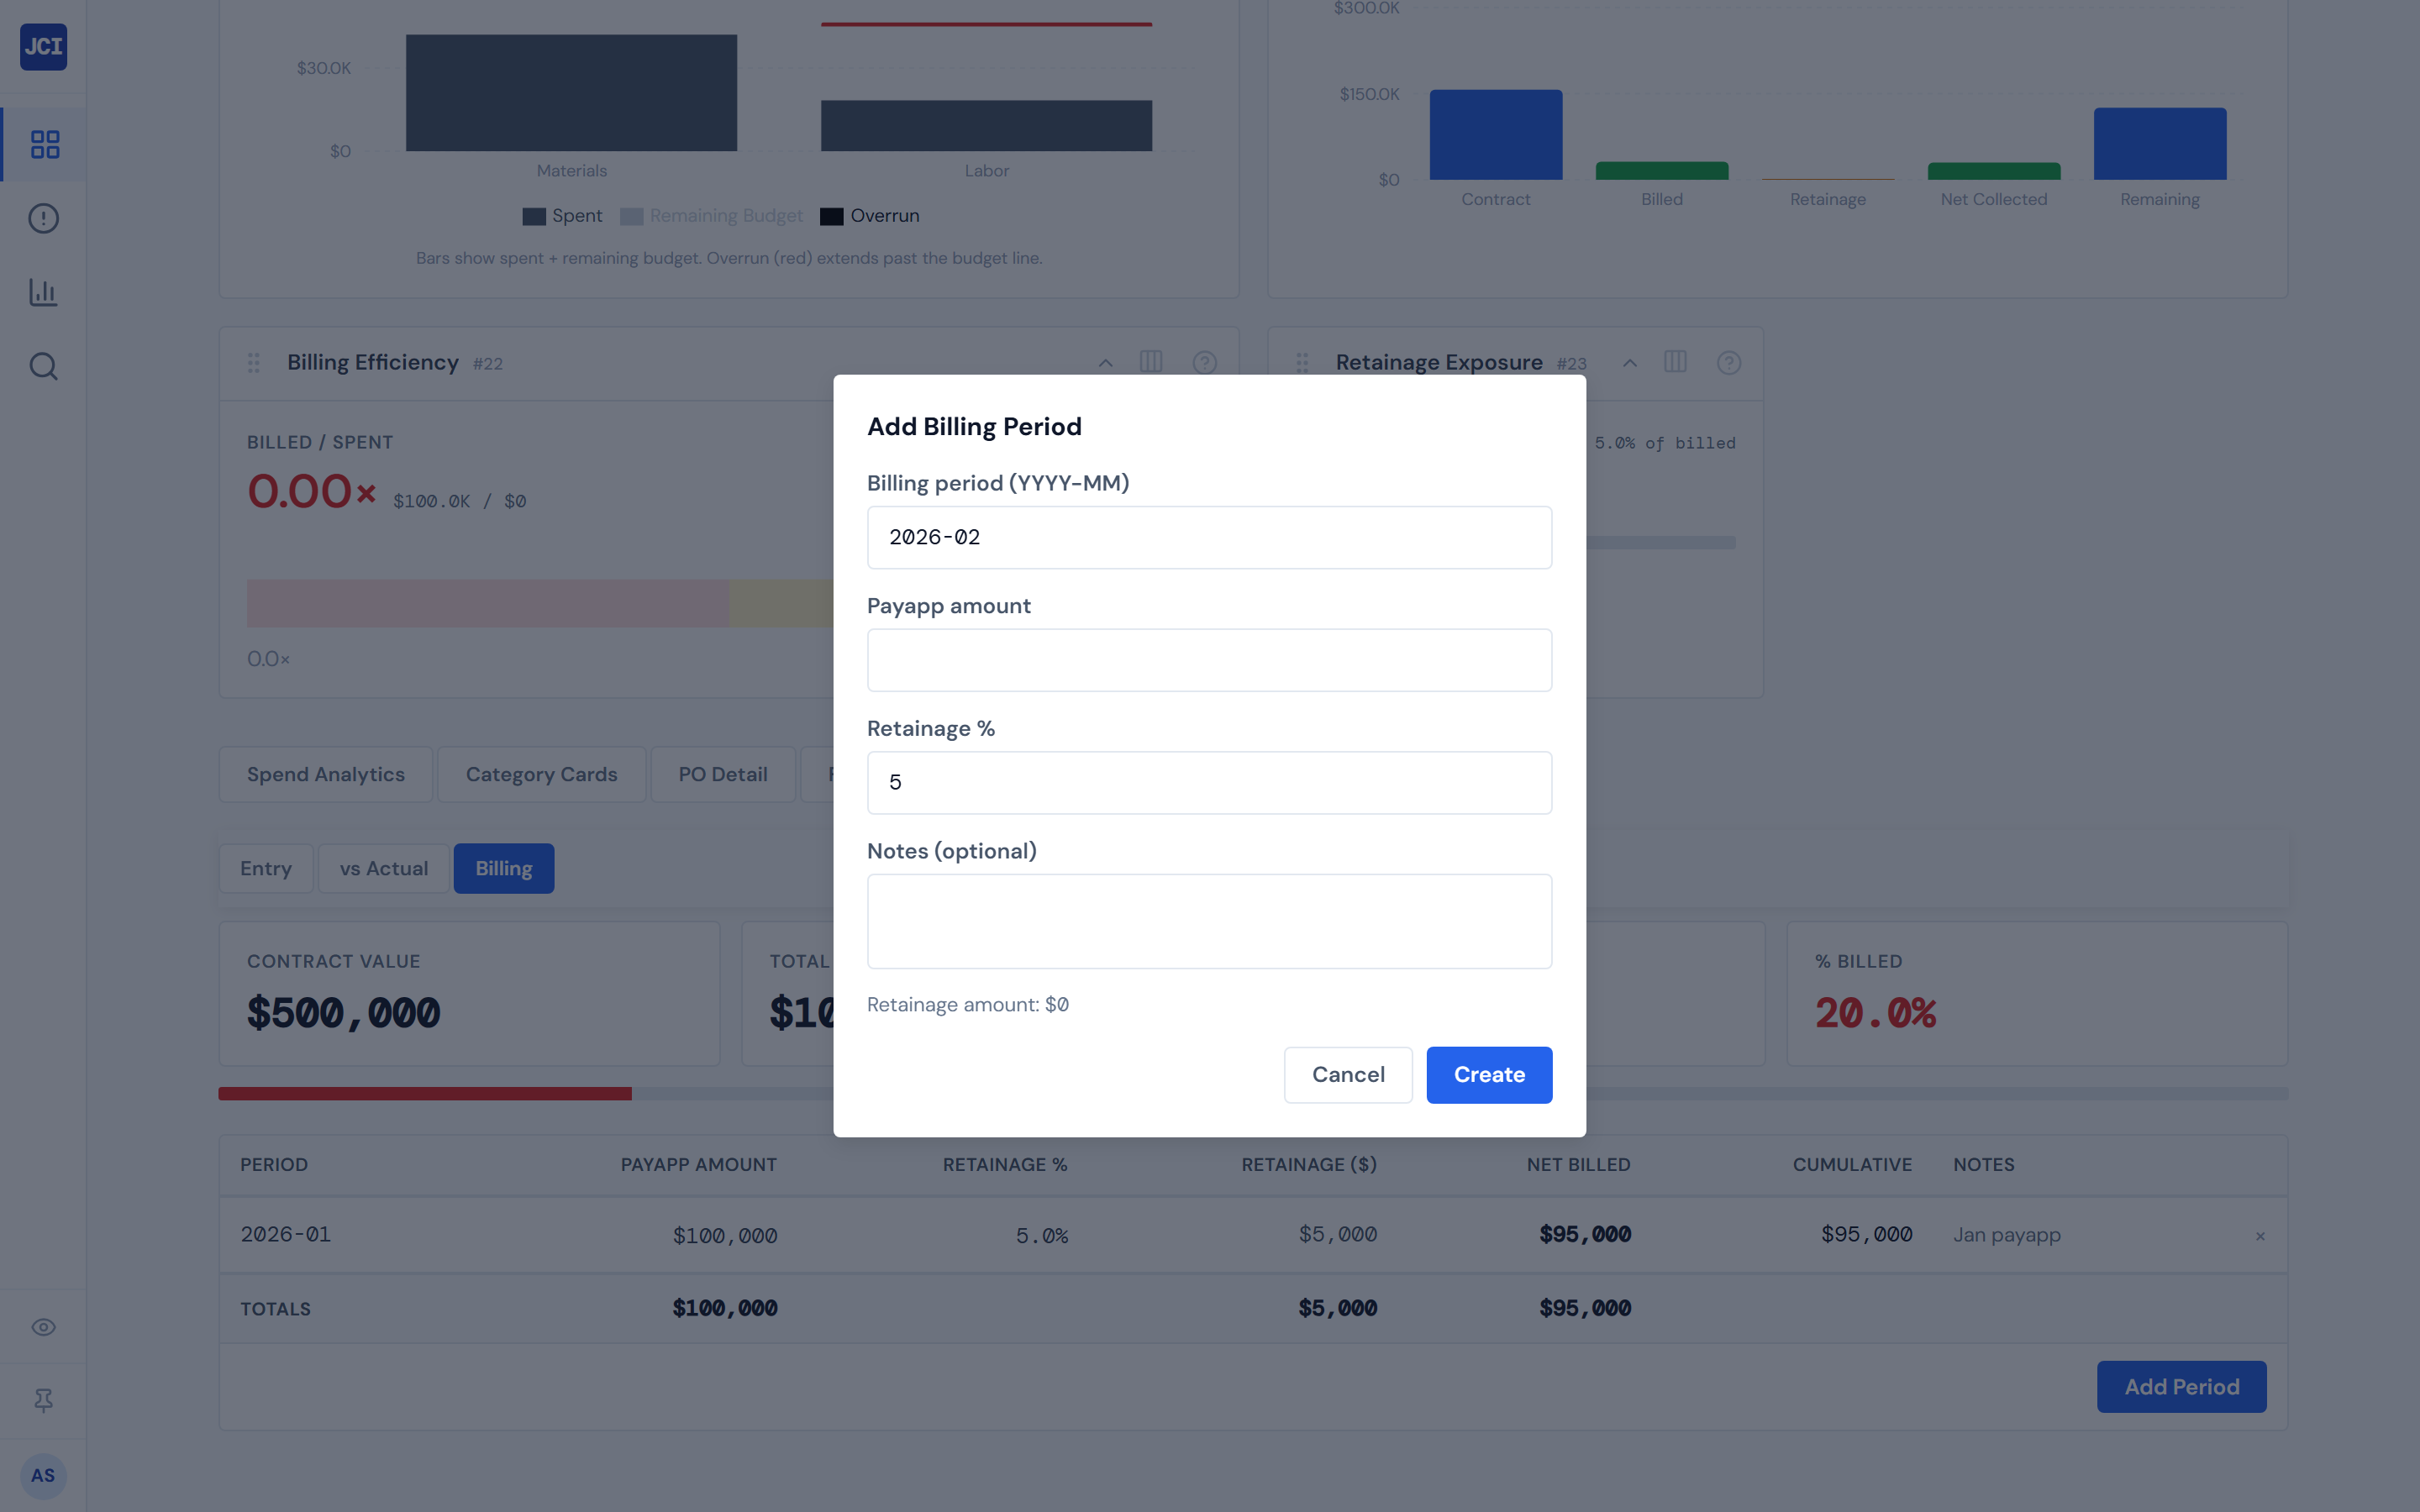
1. Add the new month's billing period to every active job that bills monthly
Open each job → Budget tab → Billing sub-tab → + Add billing period → enter payapp and confirm retainage. The full workflow is at Tracking Billing and Retainage.
This is usually the first thing finance teams want done. The remaining steps assume the billing entries are already in.
The vs Actual variance and the % Billed scorecards on each job read what you've entered on Billing. Get the billing rows in before you start reading variance — that way you're reading current numbers.
2. Review vs Actual on every active job
Open each job → Budget tab → vs Actual sub-tab. The variance table sorts worst-over-budget first by default — read down from the top. For each over-budget category, expand the row to see which cost codes are driving the variance.
Note any job where the overall variance is materially over budget. The full reference is at Budget vs Actual; for the deeper investigation flow, see Spotting Overruns.
3. Review COs that closed in the month
Open each job that has a Change Order Impact banner. Scan the per-CO list for any CO with a creation date in the closing month. Note any job whose cumulative CO % crossed the 10% high-impact threshold during the period.
The full per-CO review workflow is at Reviewing a Change Order; the canonical reference is at Change Orders.
4. Run the Analytics monthly bar chart for portfolio shape
Open Analytics → scroll to the Monthly Spend by Company card. The chart shows the last eight months of spend stacked by company. Look at the most recent month's bar — is it taller, shorter, or about the same as the previous month? Use this as the "did the portfolio grow or contract" signal you bring to your ops review.
The full reference is at Trends and Weekly Spend.
The chart hardcodes visible bars for PSS, PSW, RSW, and SR. Spend on SRS, SITE DRYWALL, SRS PAINTING AND DRYWALL, and SRS AUSTIN is included in the page-level Portfolio Total scorecard above, but does not render as a visible stack in this chart.
If you work at one of those four un-stacked companies, you will not see your bar in this chart at month-end. The per-job vs Actual review (step 2) is your primary monthly signal — don't expect this chart to add anything for you. See Companies and Divisions.
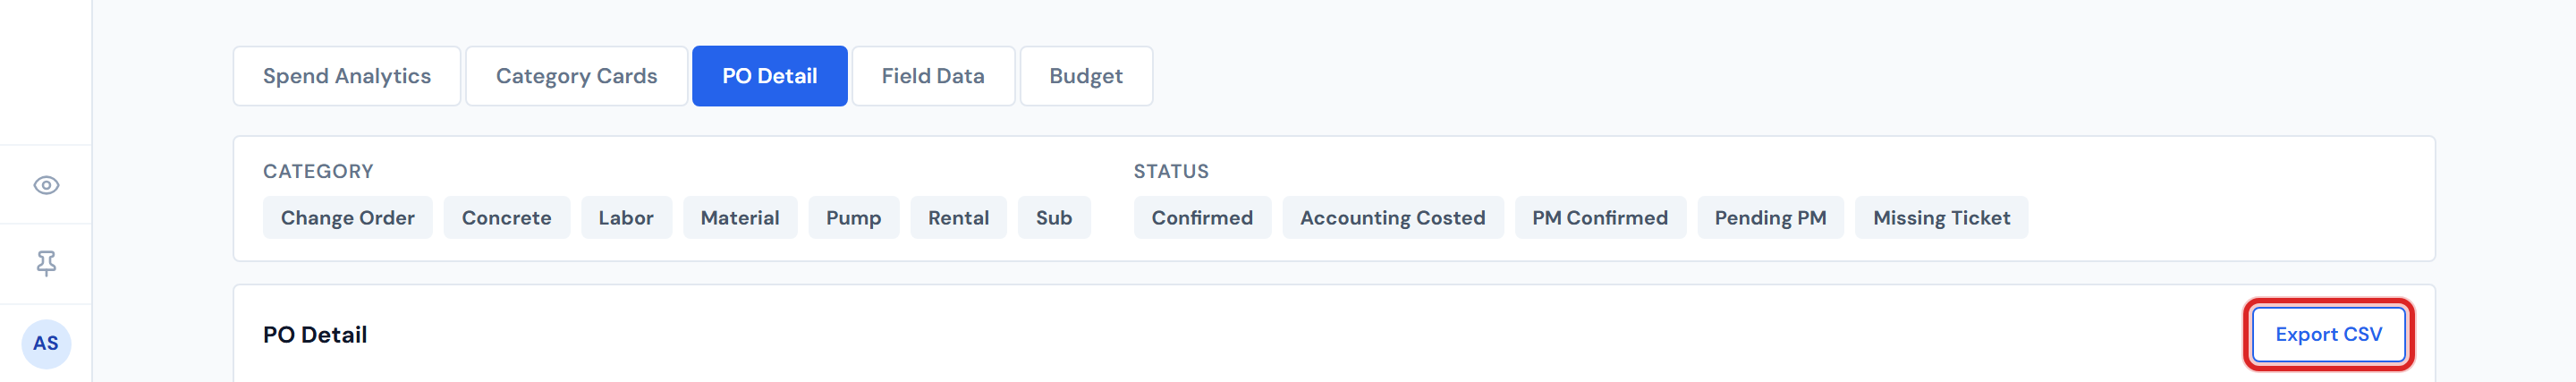
5. Export PO Detail to CSV per major job, for accounting
Open each major job → PO Detail tab → Export CSV button. The CSV reflects whatever filters you have applied on the table — apply any relevant filters first (lifecycle status, category, vendor) before exporting.
Hand the CSVs off to accounting using whatever channel your team uses (shared drive, email attachment, ticket queue). For the email variant, use the Email Report action on the same page header — it sends a PDF as a single-recipient email. If accounting comes back with follow-up questions, Copy Link gives you a bare job URL to share for re-entry.
The full CSV reference, including the per-table-vs-page-header buttons and exactly which columns ship in the file, is at CSV Export.
There's no portfolio-wide CSV — the export is per-job, scoped to the PO Detail tab on each job. Export each major job individually and combine the files yourself if accounting needs everything in one workbook.
Pairing with the Tracking Billing workflow
The monthly billing entry (step 1 above) is its own workflow at Tracking Billing and Retainage. Run the billing workflow on every active job before doing the rest of the monthly review — that way the % Billed and Cumulative numbers on each job are current when you read vs Actual.
The four-companies-only limitation, called out separately
Worth saying twice. The Monthly Spend by Company chart visually represents only four of the eight companies — PSS, PSW, RSW, SR. Spend on SRS, SITE DRYWALL, SRS PAINTING AND DRYWALL, and SRS AUSTIN appears in the page-level Portfolio Total scorecard but does not render as a stack in the monthly bars.
This is a known limitation today, not a data issue. A PM at one of those four un-stacked companies who looks for their bar at month-end will find nothing. If that's you: the per-job vs Actual review in step 2 is the primary monthly signal — don't budget on this chart.
See Companies and Divisions for the full company list, and Trends and Weekly Spend for the canonical chart reference.
What "done" looks like at end of review
You should close the page knowing:
- Every active job has a billing period for the closing month (or a documented reason it doesn't bill monthly).
- Every over-budget job has been noted and the cost codes driving the variance are identified.
- Every CO opened or closed during the period has been reviewed.
- The portfolio's monthly bar (if your company is on the chart) has been compared to the previous month.
- Accounting has the CSV exports they need.
That's the deliverable.
There is no single page that produces a "March close-out PDF" today. The monthly review is a hand-assembled set of observations from multiple tabs plus per-job CSV exports. Treat the dashboard as your data source, not as the system of record for accounting close.
Cadence
Monthly. Typically the first week of the new month. The full review on a portfolio of 10–20 active jobs takes 60–90 minutes; on a smaller portfolio, less.
If you've been running the Daily PM Routine consistently, the monthly review goes faster — nothing surprises you. If you only look at the dashboard at month-end, expect the review to take longer.
A few things to know
- The Monthly Spend by Company chart shows exactly eight months. No control to widen the window. If you want further-back history, use the Weekly Portfolio Spend area chart's "All" range, or add the Month-over-Month Slope widget for the last twelve months.
- The CSV export from PO Detail respects your active filters. Clear filters first if you want everything; narrow them first if you want a focused file.
- CO data refreshes on the four-hour materialized cycle. A CO closed in the daily-report app at the end of the month may not appear on the JCI banner until the next refresh runs. If you don't see a CO you expect, wait a cycle.
- Pump category contributes $0 to every monthly total. Doesn't affect a stacked bar's visual height (pump is a category, not a company), but worth remembering when reconciling JCI's totals against another report that handles pump differently.
- Decide your scope up front. Toggling My Jobs on Analytics also toggles it everywhere — so decide whether you're reviewing your own jobs (My Jobs on) or the full portfolio (My Jobs off) before you start, not midway through.
What's next
- Need to dig into a flagged job from step 2? See Spotting Overruns.
- A CO crossed the 10% threshold during the period? See Reviewing a Change Order.
- Daily routine is what makes the monthly review fast. See Daily PM Routine.
- Need a deeper PDF for archival or external sharing instead of CSV? See PDF Export.