Spotting Overruns
An overrun rarely shows up as one big alert. It shows up as a portfolio signal that points you at a PM, a company, or a category — and a per-job signal that tells you which scope is driving it. This page threads those surfaces together.
This is the highest-synthesis workflow in the chapter. It cross-cuts Analytics, Job Detail, and Filters.
Analytics tells you "something is hot somewhere." Job Detail tells you "here's exactly what's hot, and here's why." You'll move between the two — there isn't a single "show me overruns" page. The work is sense-making, not button-clicking.
The four-step thread
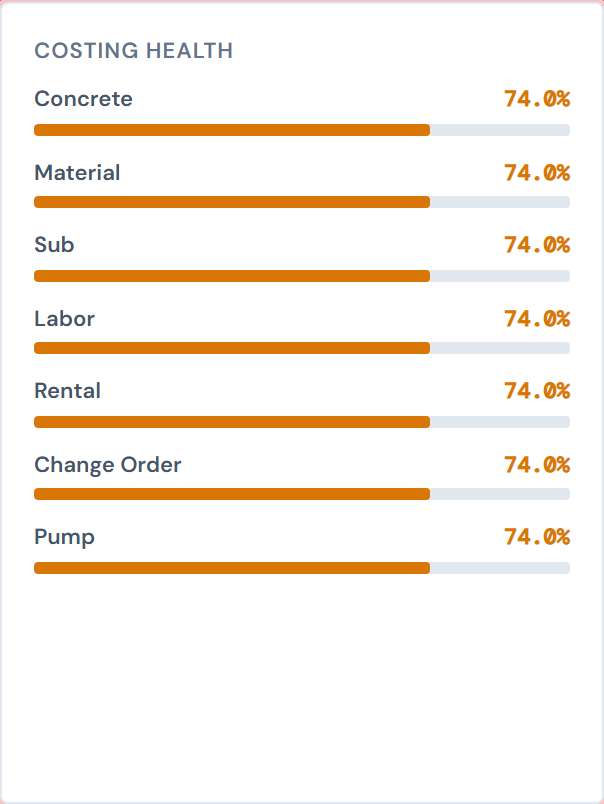
1. Start at Analytics. Read the Costing Health bars.
Open Analytics. Scroll to the Costing Health card. One horizontal bar per category, color-coded:
| Color | Threshold | What it means |
|---|---|---|
| Green | 80% or higher costed | Healthy — most of the category's spend is reconciled. |
| Amber | 40–79% costed | In-flight — significant spend is still in pending or PM-confirmed states. |
| Red | Below 40% costed | Most of the category's spend is still in pending or missing-ticket states. |
A red bar means your unconfirmed-spend exposure for that category is high. A consistently red bar at month-end suggests the category isn't being reconciled fast enough — not necessarily an overrun by itself, but a signal that the spend you're seeing isn't the whole story yet.
Clicking a red bar does nothing — these are not interactive. Remember the category, then move on. The full Costing Health reference is at Drilling into a Job.
2. (Optional) Narrow Analytics by PM or Company
Two Analytics widgets emit drill-down chips on click:
- PM Leaderboard — click a PM bar → adds a PM filter chip.
- Company Radar — click a Company legend entry → adds a Company filter chip.
The chip narrows the entire Analytics page to that PM's or that company's data. The four scorecards, the area chart, the monthly bars, and the breakdown cards all recalculate.
The chip stays on the Analytics page. Navigating to All Jobs starts you with a fresh, unfiltered page. To take the same filter to All Jobs:
- Re-apply the filter on All Jobs using the FilterBar at the top, OR
- Use Copy Link to capture the URL with the filter encoded, then paste it after navigating to All Jobs.
See Drill-down Chips and the Filter Banner for the full story.
PM Leaderboard and Company Radar drill-down clicks are scalar — they replace any multi-select PM or Company filter you had at the top of the page with the single value you clicked. If your filters seem to "shrink" after a drill click, that's why.
3. Open the flagged job
Once you've identified a candidate (a PM with elevated spend, a company whose monthly bar grew, a category running red across the portfolio), find the specific job:
- Search the job number with
Cmd/Ctrl+Kif you know it. See Global Search. - Or go to All Jobs, re-apply the relevant filter, and click the job from the table.
4. On the job, read three signals in this order
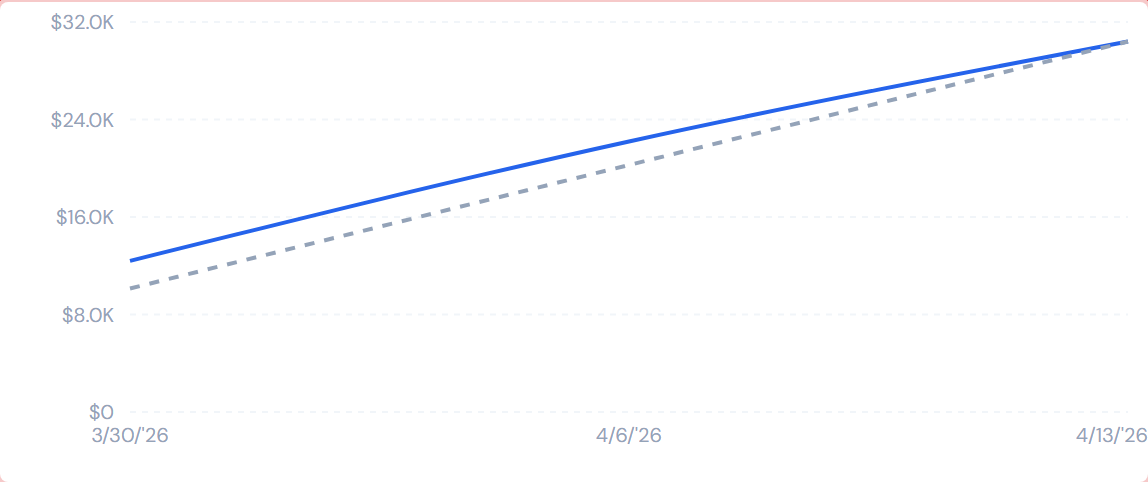
(a) Spend Analytics tab → Spend Pace widget
Spend Pace plots cumulative actual cost against a projected pace line. When actual climbs above projected, the job is spending faster than its straight-line pace. Use this as the "is this job burning hot or normal" signal.
Add it via the Widget Settings panel on the Spend Analytics tab if it isn't there yet. The full widget reference is at Spend Widgets.
It's an even distribution of total cost across the weeks worked so far — not a sophisticated forecast. A spike above projected might just mean "the project front-loaded material delivery," not "we're overrunning." Use it as a signal, not a verdict.
(b) Budget tab → vs Actual sub-tab
The variance table sorts worst-over-budget first by default. Read down from the top:
- Categories with red Variance pills are over budget.
- Click any over-budget row to expand and see the cost-code-level drill-down — which specific cost codes are driving the variance.
It shows you not just "you're over by X" but also "here's the scope where the dollars went." Expand the worst row, read the cost codes, write them down.
The full reference is at Budget vs Actual.
(c) Budget tab → Entry sub-tab → Gross Profit Est. scorecard
If the Gross Profit Est. scorecard is red, the job's category estimates already exceed the contract value — the job was budgeted at a loss before the first PO was confirmed.
This is a different kind of signal than vs Actual. It tells you the bid is wrong, not the execution.
Gross Profit red on Entry = bid issue. The numbers came in over the contract value before any work was done. Variance red on vs Actual = execution issue. The bid was reasonable; the work cost more than expected.
These are different conversations and different escalations. Read both before you walk into ops review.
If you see a red Gross Profit on a real (non-test) job, escalate to your operations lead. The full Entry reference is at Budget Entry.
Optional: the Anomaly Feed and Morning Briefing
The widget catalog includes two alert-flavored widgets — Anomaly Feed and Morning Briefing. Some PMs add these to Analytics or to a personal preset to get a top-of-mind list of unusual signals.
These widgets are opt-in, not part of the default Analytics page. They surface candidates worth a look — they don't tell you "here's the overrun." The judgment work in step 3 still has to happen. See Alert Widgets for the catalog reference.
Optional: the Cost Code Treemap
If you've added the Cost Code Treemap to Analytics, clicking a cost-code rectangle adds a Cost Code chip — useful when an overrun is concentrated in one specific scope across multiple jobs. Same chip-doesn't-persist rule applies; see step 2.
What "spotting an overrun" means in practice
You're rarely going to find a job that says "I am 40% over budget on Labor" in big red letters. What you'll find is:
- One Costing Health bar in red on Analytics, suggesting a category-wide visibility issue.
- One PM with elevated spend on PM Leaderboard.
- Two or three jobs whose vs Actual rows show red variance pills on the worst-over-budget category.
- On those jobs, three or four cost codes accounting for most of the variance.
The work is connecting those dots. The dashboard surfaces the data; you do the judgment.
What to take to your ops review
When you've finished the thread, write down:
- Which job(s) are flagged.
- The over-budget category and the top cost codes driving it.
- Whether Spend Pace is above projected.
- Whether the issue is execution (vs Actual is red) or bid (Gross Profit was already red on Entry).
- Whether COs are part of the story — see Reviewing a Change Order.
That's the briefing. The dashboard's job is to surface the candidates; your job is to interpret them.
A few things to know
- vs Actual variance only exists if you've entered a budget. A job with no saved budget shows the vs Actual empty state. If a flagged job has no budget, that is the issue: enter the budget first. See Entering a Job Budget.
- My Jobs is global. If you turn My Jobs off on Analytics to look at the full portfolio, it's also off on All Jobs. See My Jobs Toggle.
- The 4-hour refresh applies to Analytics signals. A PO confirmed an hour ago hasn't moved out of "uncosted" on the Costing Health bars yet. Don't read a red bar at 9:30 AM if you confirmed thirty POs at 9:00 AM — the bar will catch up by lunch. See Data Refresh Rates.
- Pump category contributes $0 actual to every job. The Pumps category on vs Actual will show $0 actual against any positive estimate — that's a data convention, not an overrun. Don't flag pump variance.
- The "resolved cost" you see is the accounting-costed amount when available, otherwise the confirmed cost. That ordering is consistent across every cost-showing surface in the dashboard, including the variance you read on vs Actual.
What's next
- Confirmed it's an overrun? Bring Reviewing a Change Order into the review — COs are often the underlying explanation.
- Wrapping up the monthly variance pass? See Month-End Review.
- This is part of your morning routine? See Daily PM Routine.
- Need to chase one of the over-budget POs? See Confirming a PO.
- Cost-code drill-down on vs Actual showing odd labor rows? Some labor lines may be uncoded — see Fixing a Missing Cost Code.