Weather
The Weather sub-tab overlays this job's weekly spend against the count of adverse-weather days that week, so a PM can see whether high-spend weeks line up with hot, wet, or rainy conditions on site.
It's a single chart plus a four-card summary — built to answer "did the weather mess us up?" without leaving the dashboard.
What you'll see at a glance
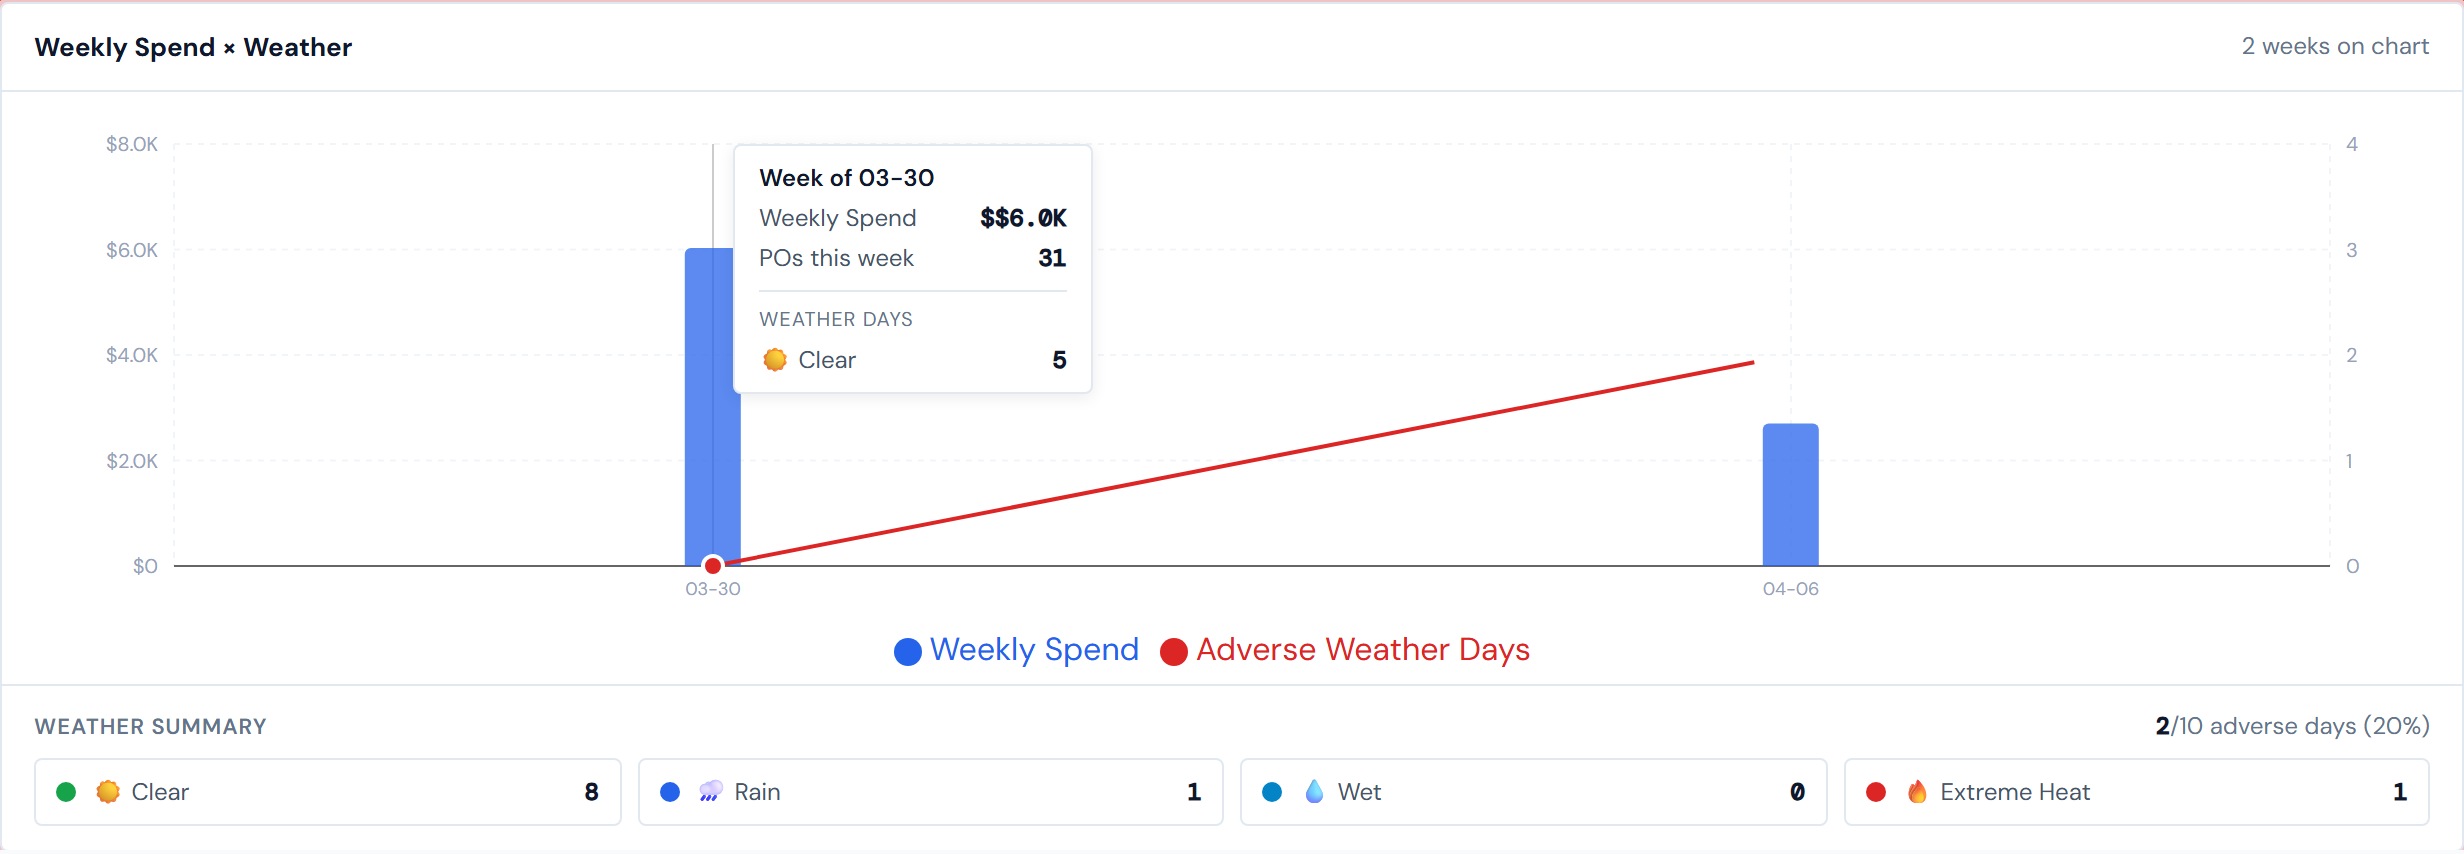
A combined bar-and-line chart titled Weekly Spend × Weather:
- Blue bars — weekly spend, plotted against the dollar axis on the left
- Red line — count of adverse-weather days that week, plotted against the day-count axis on the right (small integers, typically 0 to a handful)
Below the chart, a four-card summary shows total days for each weather condition across the job's full history.
How to read the chart
The two axes are deliberately mismatched in scale — the bars are in dollars, the line is in days. Reading them together tells you whether bad weather and high spend lined up.
Hover any bar for the tooltip — it shows the week start date, the weekly spend total, and a per-condition breakdown of how many days that week were Clear, Rain, Wet, or Extreme Heat.
The X-axis auto-thins its labels for long jobs so dates don't overlap.
The four weather conditions
Every daily report on this job gets tagged with one of four condition types — that's the full list, no others:
| Condition | What it means |
|---|---|
| Clear (sun icon) | The only "good day" condition |
| Rain (rain icon) | Adverse — actively raining on site |
| Wet (droplet icon) | Adverse — wet site, but not actively raining (typically the day after rain) |
| Extreme Heat (fire icon) | Adverse |
Wet is its own condition, not a flavor of Rain. It usually means the site was wet from prior rain even if the current day was dry. Some PMs read "Wet" the first time and assume it's a mislabeling — it isn't. Wet still counts as adverse.
What "adverse" means
Adverse days = Rain + Wet + Extreme Heat. Clear is the only non-adverse condition.
The summary header reads "X / Y adverse days (Z%)" — that's the count of adverse days over the count of total reported days, with the percentage in parentheses. So "60 adverse / 100 reported" means 40 Clear days and 60 days split across the three adverse conditions.
The red line on the chart is the same math, broken out per week.
The four condition cards
Under the chart, four cards — one per condition — show the icon, condition name, and the total days across the job's full history. The number on each card is the day count, not the percentage.
Weeks start on Monday
The X-axis shows the Monday-start date of each week. A late-week storm and the following Monday's spend will land in different bars — be aware when correlating.
Weeks here align Monday-to-Sunday. A Friday storm and the next Monday's spend bar are in different weeks even though they're consecutive workdays.
Weather is per daily report, not per calendar day
If no daily report was filed for a Saturday — or any other day — that day contributes no weather data, even if it stormed. The "X / Y adverse days (Z%)" denominator is reported days, not calendar days.
Weather days are counted from daily reports, not from the calendar. A weekend without a report contributes zero weather, even in the middle of a hurricane. If reporting was sparse, the weather summary will be sparse to match.
What the chart does not show
Weather here is categorical only. There's no temperature in degrees, no precipitation in inches, no wind speed, no hourly conditions, no forecast data — just the four condition buckets above.
If you need quantitative weather (a degree count, an inch of rain, a wind reading), this page won't have it — those metrics aren't tracked in the daily reports. You'll need a different source.
Spend and weather refresh on different schedules
Spend bars come from the dashboard's four-hour PO refresh cycle. Weather counts come from the nightly daily-report refresh. So spend can be ahead of weather by up to a working day on the freshest weeks. See Data refresh rates for the full picture.
Pump $0 still applies
Pump-category spend is always $0 in source data, so it never moves the bars. If a PM expects pumping costs to nudge a week's bar, they won't — that's by design across the dashboard, not weather-specific. See Categories for the full picture.
Empty state
A job with no weekly spend and no weather data shows "No weekly spend or weather data available for this job." Common on brand-new jobs that haven't yet generated either.
Related pages
- Daily Reports — the source of every weather tag (each report picks one condition)
- Spend Analytics tab — the spend side of this chart on a larger surface
- Spend widgets — for portfolio-level spend-vs-weather widgets
- Data refresh rates — for the spend-vs-weather cadence mismatch
- Glossary — entries for "Adverse weather," "Weather condition," "Wet," "Reported day"